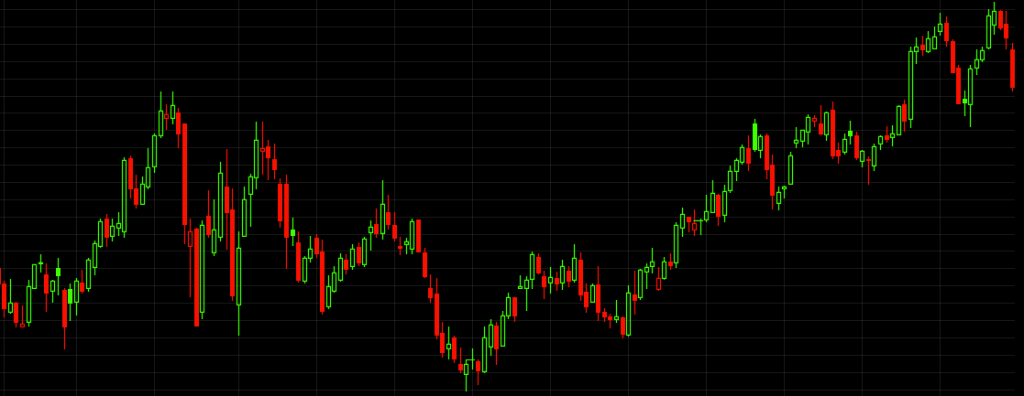
Hint this week: Weekly chart dating back to 2011.
Try to guess:
- The ticker symbol of the chart;
- The sector in which the stock trades; and
- Whether or not you think the stock will move higher or lower throughout 2014 or will break lower.
Thank you to everyone who has been playing along.
Please click on chart to enlarge
[Members: My latest Weekly Strategy Session has been published]
________________________________________________________________
If you enjoy the content at iBankCoin, please follow us on Twitter


It’s a chart of TIF Tiffany & Co. They just missed earnings expectations but had a decent quarter. It hasn’t traded below the 200-day moving average since 2012 and it’s fairly close now. It’s probably a buy in the 82-85 area with a stop at 80 (the Feb low).
Yup. Cats strikes again haha.