
A big congratulations and tip of the hat to one of the OG’s of “Name That Chart, @StockCats, for correctly guessing the mystery chart from my last post.
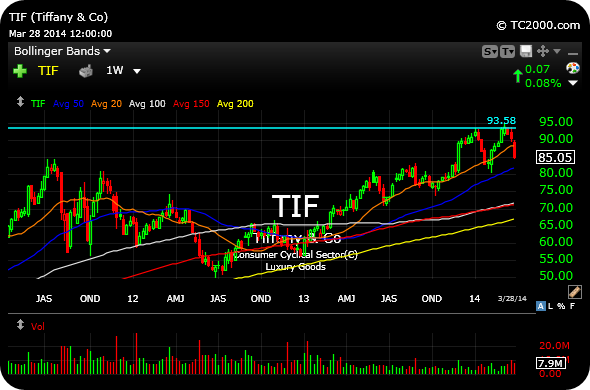
As @StockCats noted, the chart was a weekly chart view of Tiffany & Co..
Specifically, here is what @StockCats had to say:
It’s a chart of TIF Tiffany & Co. They just missed earnings expectations but had a decent quarter. It hasn’t traded below the 200-day moving average since 2012 and it’s fairly close now. It’s probably a buy in the 82-85 area with a stop at 80 (the Feb low).
Tiffany is just one of many retail plays to get hit hard in recent weeks.
What do you think about TIF and similar higher-end retail plays?
Thank you to everyone who played.
I will be back after midnight with ideas for Monday.
But I already gave tight analysis in my latest Weekly Strategy Session published, earlier today. Check it out!
______________________________________________________________


Great pic Chess! I really enjoy the challenge of “the game” each week.
Terrific job, once again. Thank you.
You rule for this chess!
Thank you, brother.