iBankCoin
Home / Tag Archives: biotech

Tag Archives: biotech

Shifting with the wind- from the gale of $NUGT to the gust of $INO

It was quite a strange morning.  The leaves were wavering a little harder, the fallen leaf flew a little further out, and most important of all, my eyes were bombarded by flying tiny debris such that I had to squint to see what kind of wind was blowing my way…

Being in a twilight state of consciousness, the winds formed into the shape of an animal… and the horns looked familiar… OMG! they were bull’s horns.  The image was like a slow motion replay of a bull stampede scene  you saw in Lone Ranger movie.  Because they were winds, the bulls ran right through me as if I was merely a shadow of the nearby tree.  From my vantage point, I could see the burned mark on one of the bull.  It was branded at $INO.

The gust of $INO was getting ready to stampede!  I immediately checked the price.  It was printing over $1.30 by the time I checked the screen.  I could sense this move had a malevolent tone and the desperation in the price action was quite palpable.  Without hesitation, I clicked on the buy button again, again, again, and again.  The fills were completed in a stair-step fashion with each fills higher than the others.

Then I wait.

Price action did not falter.  Not only did price action take out the yesterday high, it took out $1.50 resistance.  And for that, I added more.

By day end, the gust of $INO has taken my position to $1.68.

The interesting part about my hitching the gust of $INO today was that I was just getting off the gale of $NUGT.  $NUGT’s gale had taken me for a ride from the bottom of the valley to the top of mountain where I could see the $100 roll dangling outside my reach.  There were magic involved for I had started off at low $5.xx at the beginning of the ride.  Out of nowhere, the ETF master flipped the wand and I was seeing $98.xx!  As I reached out to the $100 roll, the gale suddenly dissolved into a tepid breeze and I was left standing at $89.6x.  So much for the $100 roll.

Without missing a step, I’m now riding the gust of $INO.  How far can I ride this gust?  Will it even head in the same direction tomorrow?  I sure do hope so.  I could feel the energy.  I could hear the crying.  I believed they were the cry of the shorts being squeezed.

Holy Cow!  The Gust of $INO might just continue to fly straight ahead on the back of the short-squeezed runaway…  YEOWWWWEEE! The pain!  The pain!” uttered the shorts…

My 2 cents…


Comments »

Can we play 3D catch up with $ONVO?

How many missed the $DDD, $SSYS, $PRLB, $XONE run when we had a chance to buy in mid-March but didn’t?

$ONVO, a biotech 3D, has recently been uplisted to NYSE; therefore, it is no longer an OTC bulletin board stock.  This mean all the big guys (institutional and mutual funds holders) can now buy this stock.

$ONVO has two beta-risks lumped together- biotech and new technology.  If this technology and biotech show any hint of proof of concept to create 3D human organ parts for replacing our diseased organs, this company will leave $DDD, $SSYS, etc in the dust.  On the other hand, be prepared for further dilution from secondary offering when money run out in the future.

I believe the weekly chart below is sufficed to show you the breakout pattern.

ONVO_weekly

I bought some today and added more when price continued higher.

My 2 cents.

Comments »

Is $CUR leading the stem cell miracle?

Price action seems to suggest it.

Take a look at the daily chart below:

CUR_daily

Today price has finally broken up to the upside.

However, take a look at the weekly chart below:

cur_weekly

There is still another hurdle for price action to take out and that is the resistance established back in June and July of last year.  And if today momentum continues on this week, it will be like cutting butter with a hot knife.

Fundamentally speaking, I’ll let you read this article and ponder.

Yes, I’ve already placed my bet on this one.

My 2 cents.

Comments »

Is $INO the ultimate breakout play?

I’m betting that it is.

Let’s start with the weekly chart:

INO_weekly

Last week breakout bar had massive volume of 23 million shares; while the inverted hammer candlestick of last week was not convincingly bullish; this week up bar clear up last week indecision.  Today is only the 2nd day of the week and volume has already exceeded half of last week.

Below is the daily chart:

INO_daily

The uptrend looks more straight forward than the weekly chart since you are not looking at the inverted hammer candlestick bar.

The monthly chart below gives you an idea of the possible resistances and potential of future price action.

INO_monthly

Did you see how price action has finally broken out of a 2 years consolidation period (from mid-2011 to now)?  Remember the old saying, “the longer the consolidation period, the more powerful is the breakout?”  Does this old saying apply to $INO?

I’ve placed my bet that $INO can be the mother-of-all biotech speculation with a high reward/risk ratio at this level.

Fundamentally speaking, $INO is pushing synthetic DNA vaccines into the new frontier of biotech discovery.  $INO has come a long way in researching on this field and 2013-2014 may be the years of acknowledgement that this science actually works (or not).  So far, the data are encouraging; however, the caveat is that these data are from preclinical and Phase I results.  Between now and 2014, results from various Phase I to Phase II trials will either propel $INO to much higher price or send it back to oblivion.

The risk is high and so is the reward.  If there is such a thing as mother-of-all biotech speculation, this is it.  And this is definitely not for the faint of heart.

My 2 cents.

Comments »

Bottoming Alert!

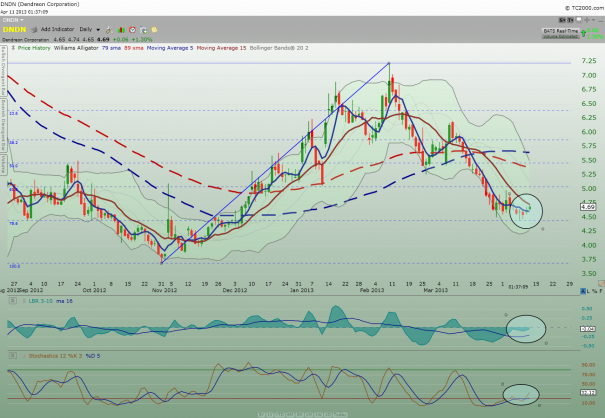
I’ve been watching $DNDN on and off and today the quantum computer in my head is alerting me that we may be seeing a bottom here.

Take a look at the daily chart below:

DNDN_daily

Did you see the low from earlier this week landed right on the 78.6% Fib retracement?  Did you also see how the two momentum indicators below both turn up and how the price action today is reflecting a “rounding up” pattern?

Price action today also crossed over the 5 min moving average line.  All of this give me a level of comfort to buy a starter position.

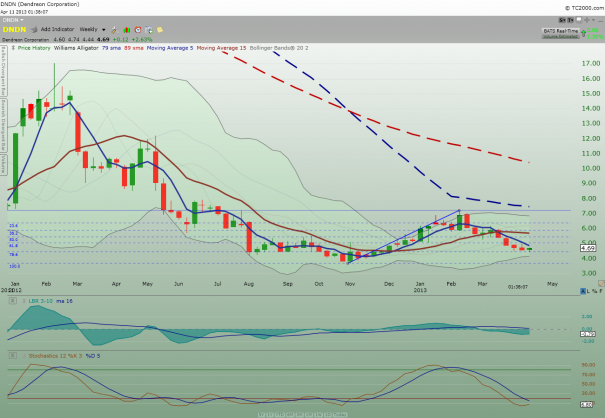
Look at the weekly chart below:

DNDN_weekly

Again, the weekly chart is just to show you the prior landscape.  If $DNDN is bottoming out here, we are in the process of starting a 3rd (impulse) wave of Elliot Wave Pattern.  FYI, the 3rd wave, if it is one, is usually the longest wave of the 5 waves pattern…

My 2 cents.

Comments »

How do you double $CERS yourself?

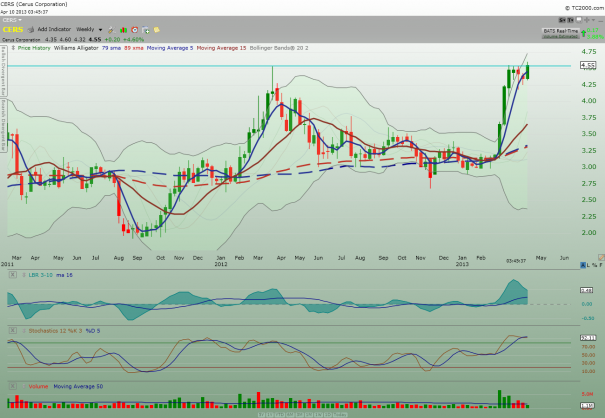
By buying the breakout of a double-top (Mar 2012 and Mar 2013) of $CERS.

Take a look at the $CERS weekly chart below:

CERS_weekly

I had traded and made money on $CERS years ago and recently missed the run from low $3 to current price.  Interesting thing was that when it was trading at low $3, my mind was saying “Hey, you better get ready for this one!”.  But I ignored that inner voice by forgetting to follow up with it.  But now that it was trading at critical breakout point, I cannot ignore it any longer.

Below is the Yahoo-Finance Profile description of the company if you are interested:

Business Summary
Cerus Corporation, together with its subsidiary, Cerus Europe B.V., operates as a biomedical products company that focuses on developing and commercializing the INTERCEPT Blood System to enhance blood safety. The company’s INTERCEPT Blood System is based on its proprietary technology for controlling biological replication and is designed to target and inactivate blood-borne pathogens, such as viruses, bacteria, and parasites, as well as potentially harmful white blood cells, while preserving the therapeutic properties of platelet, plasma, and red blood cell transfusion products. Its INTERCEPT Blood System for platelets is designed to inactivate blood-borne pathogens in platelets donated for transfusion; and INTERCEPT Blood System for plasma is designed to inactivate blood-borne pathogens in plasma donated for transfusion. The company is also developing INTERCEPT Blood System for red blood cells, which is designed to inactivate blood-borne pathogens in red blood cells donated for transfusion. It markets its platelet and plasma systems through its direct sales force and distributors primarily in Europe, the Commonwealth of Independent States, and the Middle East. The company has collaboration agreements with Baxter International, Inc. for the development and commercialization of the INTERCEPT Blood System. Cerus Corporation was founded in 1991 and is headquartered in Concord, California.

My 2 cents.

Comments »

The precognitive Doji strikes again!

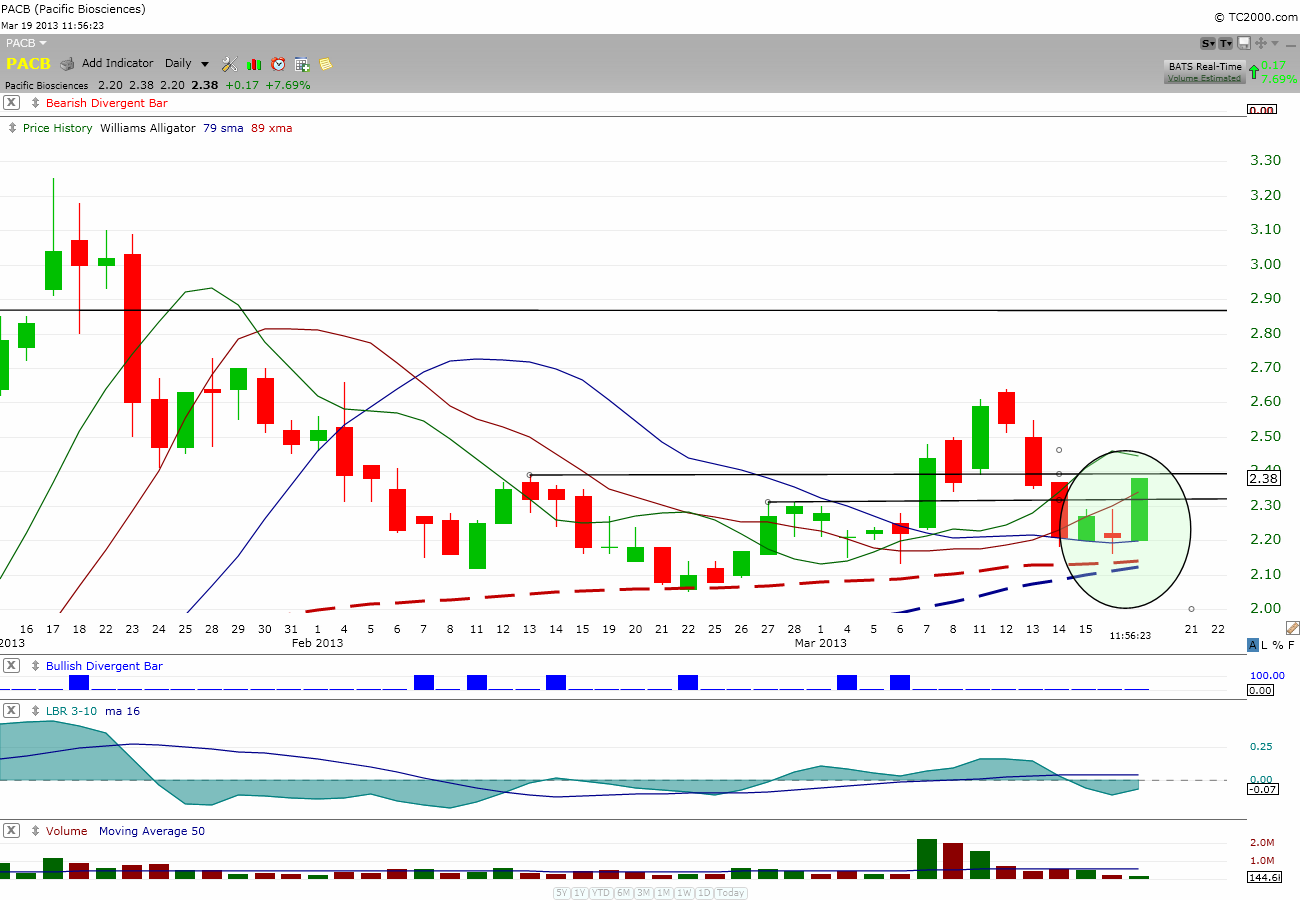
Yesterday, I saw the doji formation on $PACB above the 79 & 89 moving averages; so without hesitation, I bought back $PACB.  I did not hesitate simply because when you have a doji formation at the bottom of a downtrend near a support area, the odd (or probability) of a turnaround is high.  No, it is not 100% but the odd is in your favor.  So, like a blackjack card-counter who sees that the undistributed cards are stacked with 10s, Jacks, Queens, and Kings, he starts to bet big.  In my case, I simply bought back my position.

I also added more in the early morning because of the upward bias.

Look at the beauty below:

PACB_daily

Notice that I’ve been cutting losses on $PACB during the previous downtrend to cut loss and yet here I am back on the saddle riding the rally up.  If this doesn’t convince you the value of cutting loss fast and the fact that cutting loss earlier doesn’t mean you will miss the boat (not all the times; but some of the times), I don’t know what will?

My 2 cents.

Comments »

It’s all about the “head-up”

The way I see it, if you hear or see something that tickle your interest, you are being present an opportunity to do something about that “info” you’ve heard or seen.

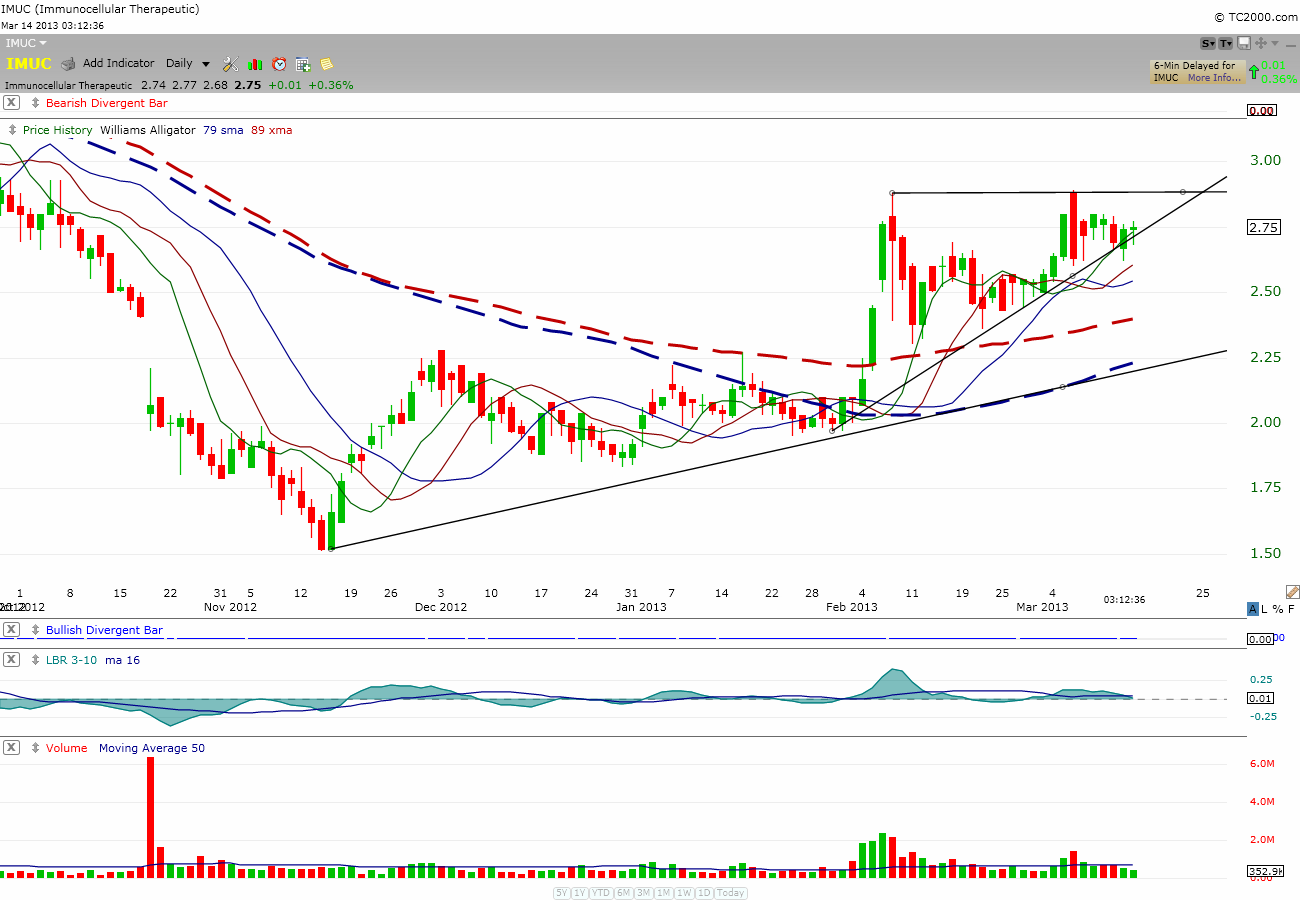
Recently, Tpain from the Blogger Network asked me about $IMUC.  I take a look at it and like the look of the chart and have told Tpain my analysis (see below):

“Hello T, I didn’t see your comment until now. By looking at the chart, the price has been on an uptrend since mid-Nov of last year. And it is now in the ascending triangle formation. The way I see it, your breakeven point is right at the long-term trend line from mid-Nov. If that line is taken out, you could still get out at breakeven.

In summary, I can’t tell you if there is a future in your stock; but you seem to be in a good position to ride this out and still get out at breakeven when the long-term trend line is violated.”

At the time, price looks like it may break out to the downside by violating the short-term uptrend line.  However, after a few days of price action, I’m convince this stock may have leg to breakout of the ascending triangle.

Take a look at the daily $IMUC chart below:

IMUC_daily

Thus, I’m willing to put my money down for this one.  Anyone looking at it has to say the price is heading higher, no?

A big Thank You to Tpain from the Blogger Network for bringing this to my attention   Bravo!

Btw, I dumped my losers stock $PACB & $DCTH to cut loss and piled some of the money into $IMUC.  Let’s see if it will work.

My 2 cents.


Comments »

Believe it or not! I bought back $DCTH today.

Simply because the chart says it is stabilizing.

Don’t believe me?

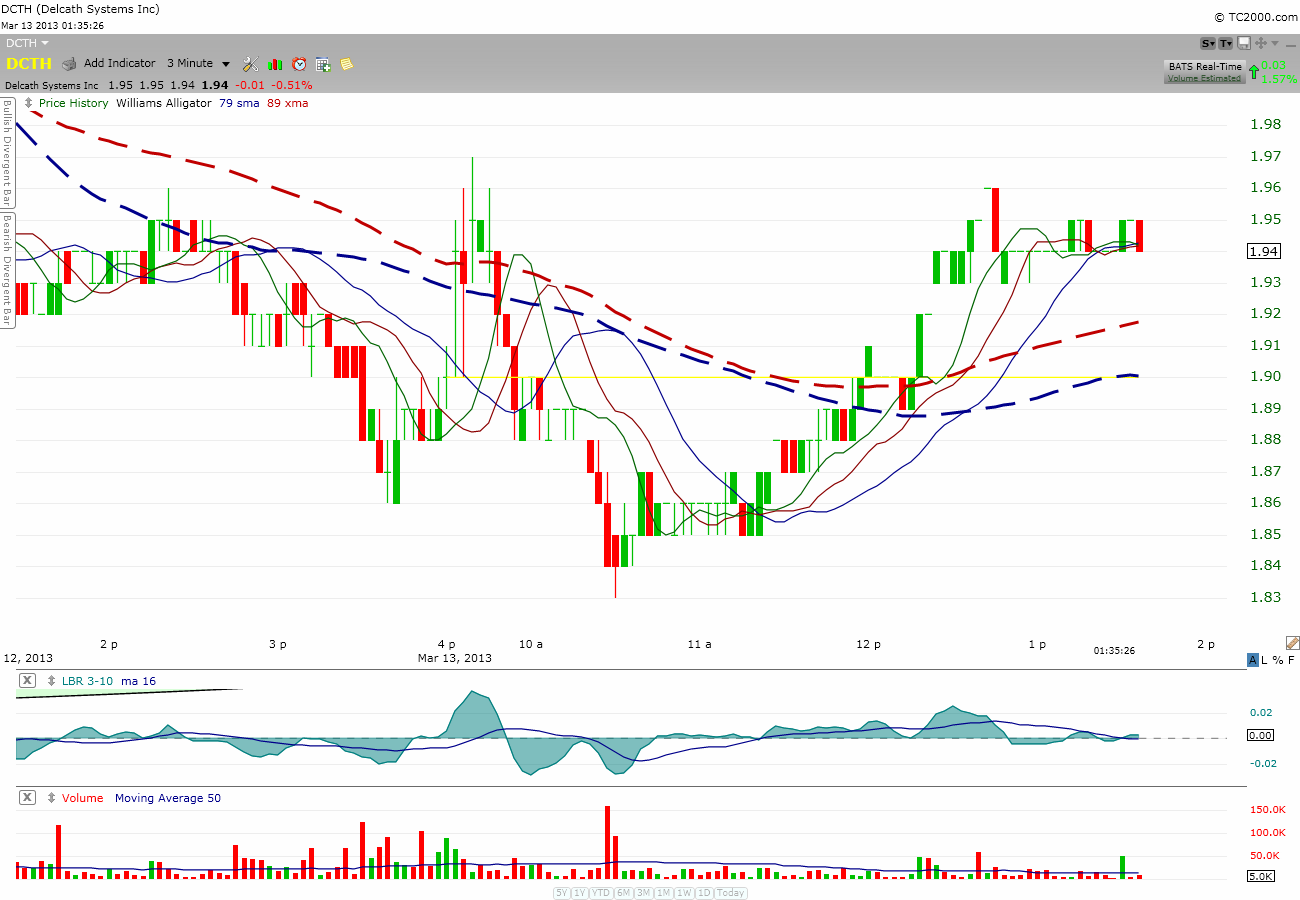
Look at the 3m chart below:

DCTH_3m

Did you see how price action climbed back up above the 89 xma and 79 sma lines?

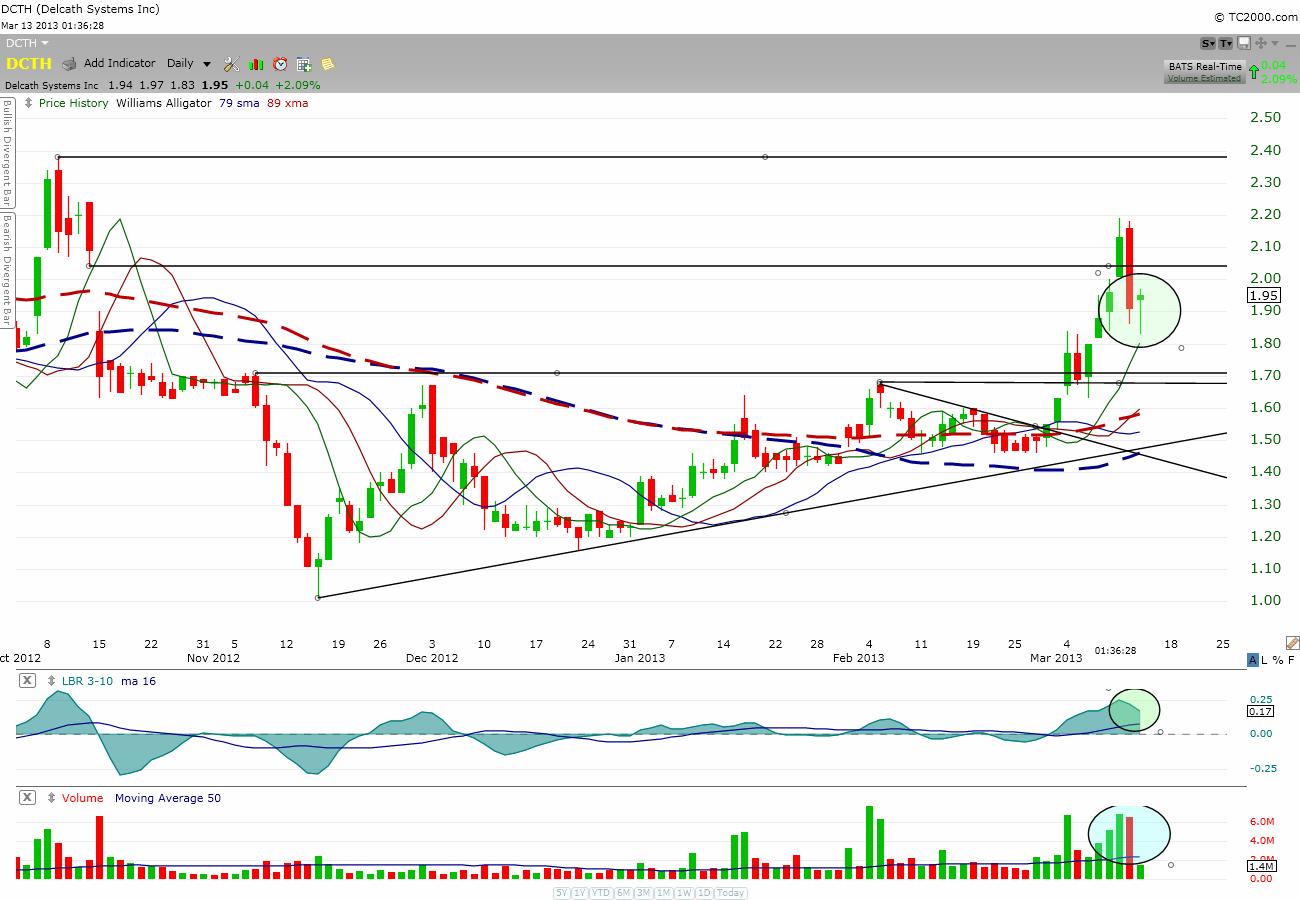
Now, look at the daily $DCTH chart.

DCTH_daily

Do you see a long-tail underneath that tadpole?  Geez!  Did I just say tadpole?  Anyway, you see my point.  The bull has taken back the force and, as a result, leave a long tail below.  I’ll add more if today high is taking out tomorrow.

My 2 cents.

Comments »