I’ve been watching $DNDN on and off and today the quantum computer in my head is alerting me that we may be seeing a bottom here.
Take a look at the daily chart below:
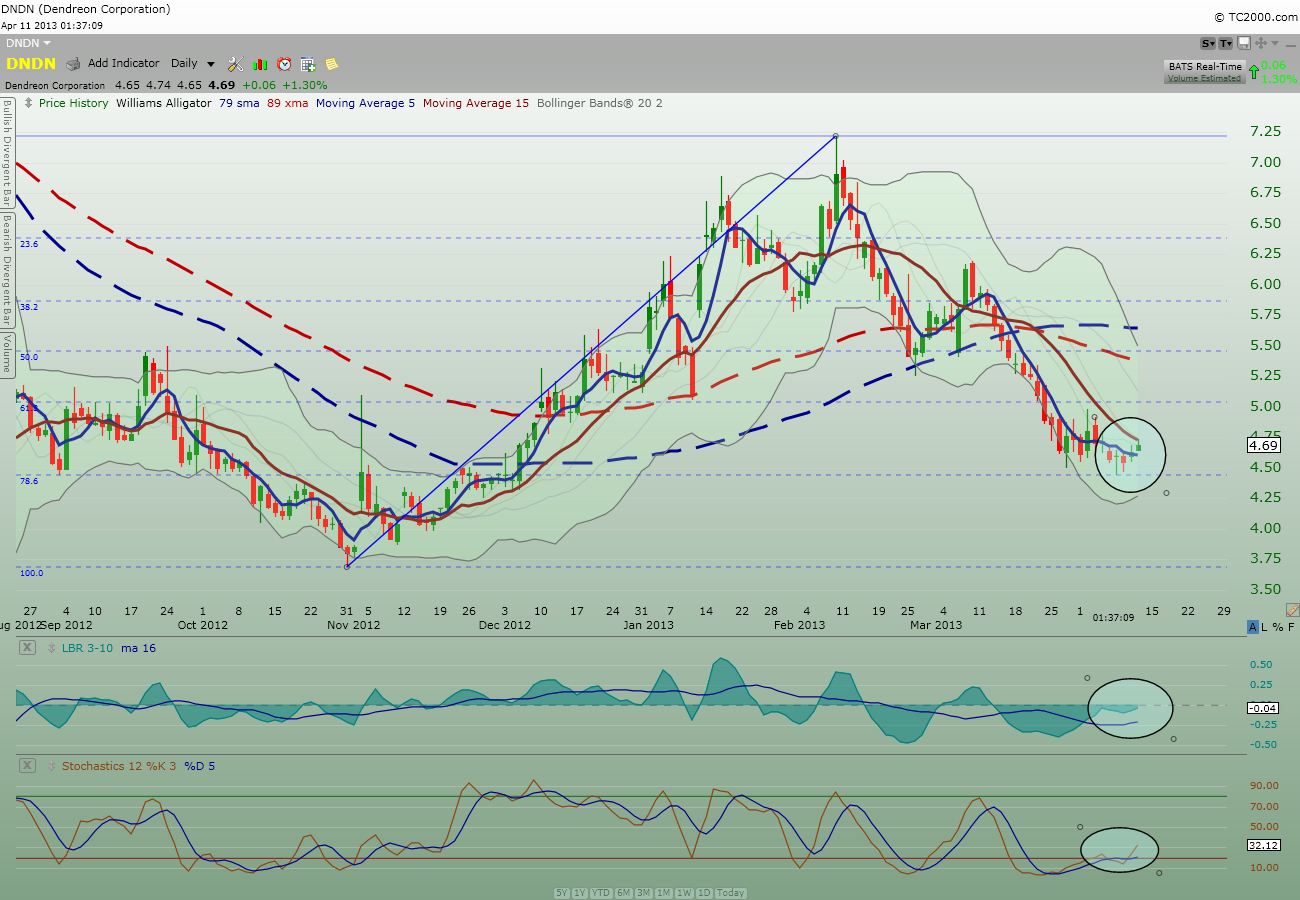
Did you see the low from earlier this week landed right on the 78.6% Fib retracement? Did you also see how the two momentum indicators below both turn up and how the price action today is reflecting a “rounding up” pattern?
Price action today also crossed over the 5 min moving average line. All of this give me a level of comfort to buy a starter position.
Look at the weekly chart below:
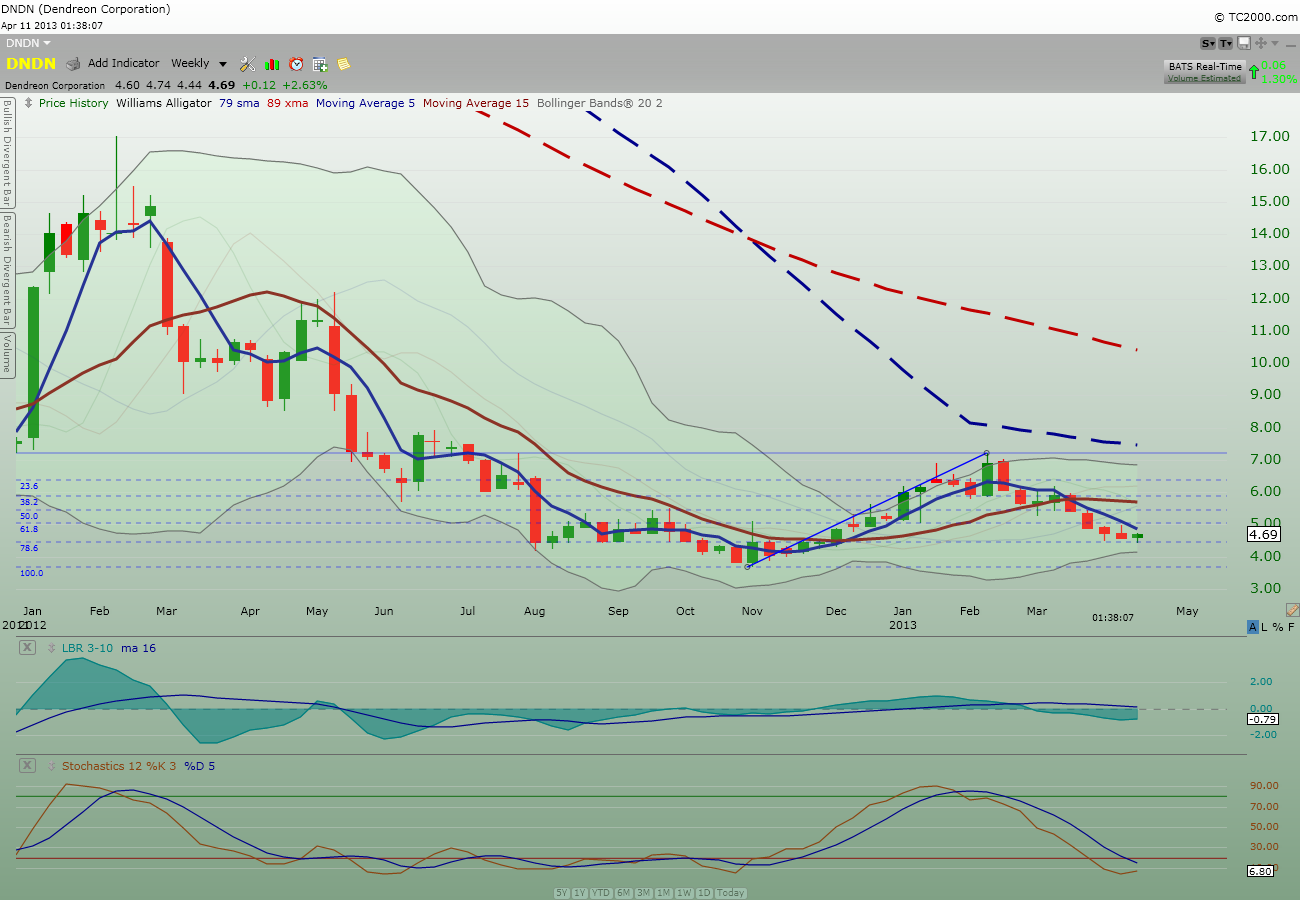
Again, the weekly chart is just to show you the prior landscape. If $DNDN is bottoming out here, we are in the process of starting a 3rd (impulse) wave of Elliot Wave Pattern. FYI, the 3rd wave, if it is one, is usually the longest wave of the 5 waves pattern…
My 2 cents.
If you enjoy the content at iBankCoin, please follow us on Twitter
