iBankCoin
Joined Nov 11, 2007
1,458 Blog Posts

Market Retraces -1%, Traders Freak Out. Really?

Via ETFProphet, I bring you a link where Tom Demark is calling for a “significant top.” It seems most of the traders out there agree with Demark and are looking for a serious pullback here, with many calling for a beyond serious, slit-yer-wrist variety of pullback.

I believe those looking for a slit-yer-wrist pullback are over reacting. In fact, I’ll go on record right here and state that this pullback will be between 3-6% on the SPY, and that  SPY will test the 1/18/2011 high before a deeper pullback occurs.

Before you remove all your hedges, know that I am engaging in a bit of braggadocio in order to generate some discussion on this matter.

I have tried to model the recent market action, and here is what I have come up with it.

The S&P 500 is up over +20% since August 31st, 2010. Today, the pullback on SPY was -1.0%. Thus we have 97 trading days since this move began (not counting today).
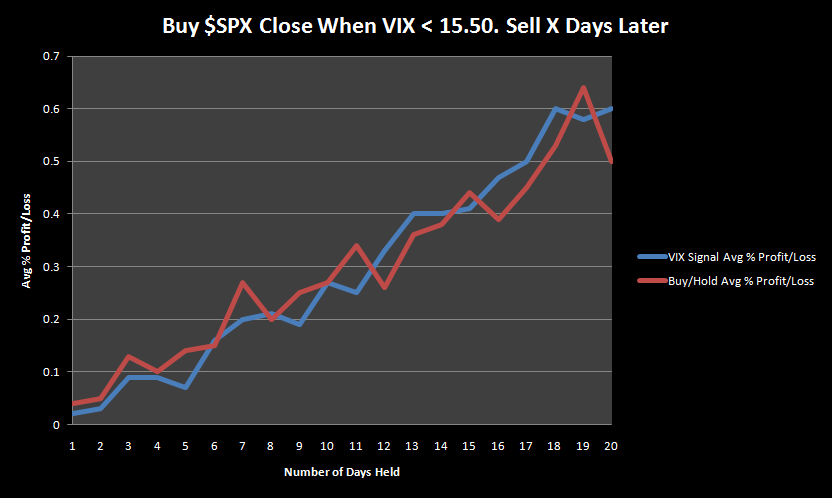
The Rules:

Buy $SPX when the 97 day Rate-of-Change > +20% AND today’s close was > -.90% beneath the previous close.

Sell X days later.

No commissions or slippage were added. I used 50 years worth of data with the first trade occurring on 10/9/1970.

The Results:

Any discussion on this type of modeling should begin with sample size. If the trade is held for the full 20 bars, there are 23 instances of this setup over the last 50 years. The statisticians would prefer 30 instances, but then that would assume that the market adheres to a standard distribution.

  • The winner average profit levels out around +3%.
  • The loser average loss levels out around -2%.
  • Based on the % of Winners and the Max. Trade % Drawdown, most of the damage tends to peak about 1 week after the setup.
  • On day 7, the % of Winners climbs above 60% and peaks at 74% on day 15.

The big takeaway here is that an object in motion (the market) tends to stay in motion (apologies to Newton). In the past, after having climbed so far, so quickly, the market’s velocity has enabled it to maintain momentum. Galileo called this inertia. The bears will likely call it “Bernankery.”

Comments »

Is The Market Cracking?

If you look over the last two months of my blog posts, you will find that I have been 100% bullish. My bullishness in the face of a perpetually overbought market is a result of running study after study, all of which suggested that the bull would continue to run.

I’m at the point now of looking for a study to suggest that the market is slowly cracking. I’m not having much luck.

One study I ran tonight shows a slight bearish divergence. It is a very simple measure of breadth. The study sums the number of stocks in an uptrend. The way I define uptrend is proprietary, but again, it is very simple. These stocks must also meet a simple volume and liquidity requirement and be listed on a major exchange.

As you can see, the uptrends (gray histogram) have not quite reached the highs of September of 2009 or April of 2010, but the market is still chugging relentlessly higher.

While this is certainly not enough evidence to change my bullish disposition, it is noteworthy.

Tomorrow night I’ll go a searchin’ for some other divergences. I have no idea whether I will find any or not.

Comments »

VIX At 2007 Levels–Should You Be Worried?

Some traders watch the VIX as they believe that when it gets too low, it signals that traders have become complacent. From Wikipedia: “Often referred to as the fear index or the fear gauge, it represents one measure of the market’s expectation of stock market volatility over the next 30 day period.”

As the tendency to fade the crowd is strong and Friday’s VIX close was low (relatively), I decided to run a simple test.

First, some historical background.

  • On March 12, 14, 15, and 20th, 2010, VIX closed at 15.58, 15.59, 15.89 and 15.73, respectively.
  • On December 22, 2010, VIX closed at 15.45.
  • On Friday, January 14, 2011,  VIX closed at 15.46.

Other than these dates, the last time the VIX closed beneath 16 was on July 19, 2007. The more astute market historians may note that July 19th, 2007, was pretty much the top of the market for the S&P 500. Yes, it re-visited those highs in October of 2007, but it was unable to close more than a half-percent higher than the July 19th close.

With the VIX now trading beneath 16, should we be worried?

The Rules:

Buy SPX at the close when VIX closes beneath 16.

Sell the close X days later.

No commissions or slippage were added.  Testing started on 1/1/1990 ( the first date I have data for $VIX) and ended on 1/14/2011.

Summary:

Over the first 2 weeks, results are about equal to buying and holding the S&P 500. Over the next 2 weeks, buying when VIX<16 gives better results than buying and holding.

This simple approach suggests that there is not much to be concerned about.

———————————————————————————————————————————————-

A word about how these results are generated:

To generate the S&P 500 returns, a buy is made and held for 1 day and then repeated, through all the data. These results are averaged. The average is what shown above Day 1. The process repeats by buying and holding for 2 days and then repeated, through all the data, with the results being averaged. That average is what is shown above Day 2. This process repeats until a 20 day buy and hold is calculated.

To generate the returns when VIX< 16, the same process is used except that there must be a signal to buy before the process starts.

Comments »

Power Dip System 2.0 Has Launched

On 1/3/11, we launched PDS 2.0. It is exactly the same as the original PDS except that the exit trades are delayed by one day. I believe that the market will stay trendy for some time and delaying the exit trade by one day allows us to ride stocks that are going up for an additional day. However, subscribers can still follow the original exit, if they choose. In fact, we are tracking the results of both exits, and in a few days we will display stats for each exit.

Below I’ve included the YTD results for the 3ATR Position-sizing model (Based on 1% Risk). This model sizes its trades based on the volatility of the stock. Check out the position value column and you will see that the more volatile stocks get smaller positions.

The other models are also doing well.

10% of Equity per Trade Model: +2.02%

20% of Equity per Trade Model: +3.12%

3ATR Position-Sizing (Based on 2% Risk) Model: +4.01%

All above results include .01/share for commissions.

S&P 500 change over same time period: +1.31%

The free trial is now available and requires only a valid email address.

Comments »

SPY Volume Study: Buying 20 Day Lows

For the kick-off post which covered buying SPY 20 day highs, go here…

I’m beginning to look at the influence of volume on price, starting with the SPY. I want to see what the influence is on the broader market before dialing it in to look at individual stocks.

Rules:

  1. Buy SPY at the close when it makes a 20 day low OR
  2. Buy SPY at the close when it makes a 20 day low with volume LESS than the 50 day average OR
  3. Buy SPY at the close when it makes a 20 day low with volume MORE than the 50 day average.
  4. Sell X days later at the close (up to 20 days later).

Results:

The reason buying 20 day lows with volume more than the 50 day average closely follows buying all 20 day lows (regardless of volume) is that most 20 day lows have come with volume greater than the 50 day average. This means that when a 20 day low is made, and volume is less than the 50 day average, it is a somewhat abnormal event.

Note that low volume doesn’t significantly affect returns until after the 6th day. It appears that when a 20 day low is made and there is some capitulation (with capitulation being volume running above average), the low is more likely to result in gains over the next 20 days. Conversely, new 20 day lows made on low volume have tended not to hold.

The question then is does this apply to individual stocks? If we are dip buying a new low, will we see better results if the low comes on higher than average volume? We’ll see…

Comments »

Abnormally Overbought Market Exceeding Expectations

Back on 12/13/10 I noted that the abnormally overbought S&P 500 was not bearish. I followed up with another post to begin tracking the current performance against the average of all previous abnormally overbought performances.

After a month of trading since the original 12/10/11 signal, SPY is currently out-performing compared against the average of all previous abnormally overbought performances .

At this point, the S&P 500 could trade sideways for the next month and it would still meet or exceed the average performance.

Comments »

First Week of January: Is It an Omen?

Readers have been clamoring to know what happens after the first trading week of the year. If the week is up, does this portend a successful year?

Just a quick glance at the graph below seems to suggest a relationship…

1stWk.Return = Close of last trading day of year to close of 5th trading day of next year.

ROY % Chg = Close of 5th trading day of year to close of last trading day of year (Rest of Year % Change).

Now, let’s look at a simple system with these rules: Buy the 5th close of the year and hold for the rest of the year if the 1st week of the year closes with gains. No commissions or slippage included.

Results:

All Trades = 38

Avg. Profit/Loss % = 12.01%

% of Winners = 78.95%

Compound Annual Growth Rate = 6.74%

Surprisingly good results…

So what happens if we buy after the first week is down?

Results:

All Trades = 23

Avg. Profit/Loss % = 2.42%

% of Winners = 52.17%

Compound Annual Growth Rate = 0.30%

————————————————————————————————————

Summary:

Truthfully, I was surprised to see these results. Before I’d be willing to trust that there is truly an edge in this setup, I would want to run a test that cycles through 52 weeks at a time, buying after any up week and holding for another 51 weeks. I have a feeling that running such a test would show that this omen is only random luck. There are likely weeks that have consistently performed better over the past 60 years, but who knows for sure until the test is run?

Here is the code for the AmiBroker crowd:

//First Week of January
//woodshedder73 at gmail dot com
SetTradeDelays(0,0,0,0);
SetOption(“MaxOpenPositions”, 1 );
PositionSize = -100/1;
Mo=Month();
FirstDay=(Mo==1 AND Ref(Mo,-1)==12);
EODC = ValueWhen(Mo==12 AND Ref(Mo,1)==1,C); //EODC is End of December Close
EOFW = ValueWhen(BarsSince(FirstDay)==4,C);  // EOFW is End of First Week
FirstWeekRet = (EOFW-EODC)/EODC;
Buy = Mo==1 AND BarsSince(FirstDay)==4 AND FirstWeekRet<0;
Sell = IIf(DayOfYear() > Ref(DayOfYear(), 1), 1, 0);
Filter = Buy;
BuyPrice = Close;
SellPrice = Close;
//Report
AddColumn(Close, “Close”);
AddColumn(EODC, “EODC”);
AddColumn(EOFW, “EOFW”);
AddColumn(FirstWeekRet, “1stWeekReturn”, 1.4);
AddColumn(BuyPrice, “BuyPrice”);

Comments »