Some traders watch the VIX as they believe that when it gets too low, it signals that traders have become complacent. From Wikipedia: “Often referred to as the fear index or the fear gauge, it represents one measure of the market’s expectation of stock market volatility over the next 30 day period.”
As the tendency to fade the crowd is strong and Friday’s VIX close was low (relatively), I decided to run a simple test.
First, some historical background.
- On March 12, 14, 15, and 20th, 2010, VIX closed at 15.58, 15.59, 15.89 and 15.73, respectively.
- On December 22, 2010, VIX closed at 15.45.
- On Friday, January 14, 2011, VIX closed at 15.46.
Other than these dates, the last time the VIX closed beneath 16 was on July 19, 2007. The more astute market historians may note that July 19th, 2007, was pretty much the top of the market for the S&P 500. Yes, it re-visited those highs in October of 2007, but it was unable to close more than a half-percent higher than the July 19th close.
With the VIX now trading beneath 16, should we be worried?
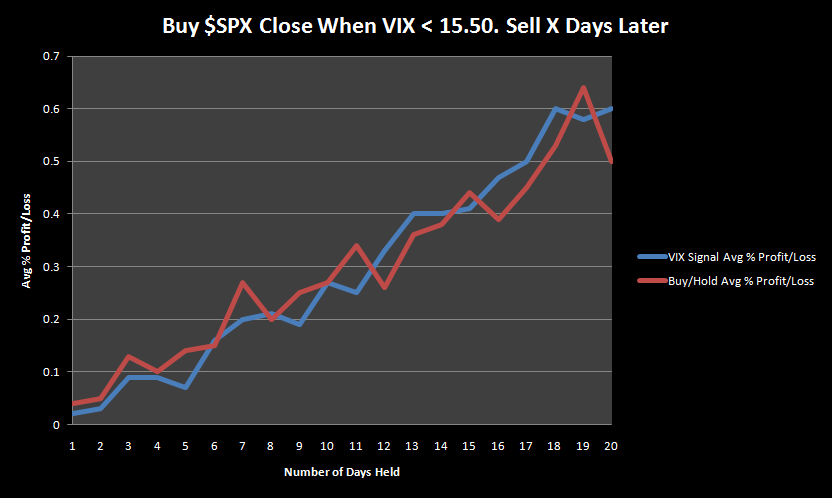
The Rules:
Buy SPX at the close when VIX closes beneath 16.
Sell the close X days later.
No commissions or slippage were added. Testing started on 1/1/1990 ( the first date I have data for $VIX) and ended on 1/14/2011.

Summary:
Over the first 2 weeks, results are about equal to buying and holding the S&P 500. Over the next 2 weeks, buying when VIX<16 gives better results than buying and holding.
This simple approach suggests that there is not much to be concerned about.
———————————————————————————————————————————————-
A word about how these results are generated:
To generate the S&P 500 returns, a buy is made and held for 1 day and then repeated, through all the data. These results are averaged. The average is what shown above Day 1. The process repeats by buying and holding for 2 days and then repeated, through all the data, with the results being averaged. That average is what is shown above Day 2. This process repeats until a 20 day buy and hold is calculated.
To generate the returns when VIX< 16, the same process is used except that there must be a signal to buy before the process starts.


Just from looking at your breakdown, it seems like there are basically three time periods where the VIX has closed below 16 – July 2007, March 2010, and now. There was a significant correction in 2007 and in April-May 2010. So, it seems like there’s still cause for concern in my book. Less than a month after the extreme complacency and you may be all right, but I’m still fearful past mid-February. Maybe this time will be different, though. With only two data points (in my mind anyway), we do seem to be in somewhat uncharted territory. The good thing about system trading, of course, is that once you’re in your in regardless of how insanely overbought the market is.
Data, there were either 108 or 180 (can’t remember which one right now) trades made when the VIX is less than 16 where the system held the trade for the full 20 days.
For the test, I did not require a cross beneath 16 from above to enter the trade, only that the VIX is less than 16. Over the past 20 years there were significant amounts of time when the VIX was less than 16.
Ah, I gotcha. Don’t why I was thinking it was the crossover buy signal. Of course volatility may not be extremely low for much longer after last night… hopefully, the pain won’t be too bad. Maybe a good buy in point, though.
Wood,
You may want to take a gander at the latest post over at mysimplequant.blogspot.com – he just put up a study looking at the VIX in terms of its Bollinger Bands and from that view the current situation appears to have a market-negative bias to it.
KTB
KTB, thanks for sending me over there. That is a good post and a good companion read to this post. Seems like Chris and I were thinking about the same things over the weekend.