After the best October in a generation, I seriously doubt November will be nearly as stellar. However, there is research that shows a precedence for further gains, even after huge gains the month before. The average return of 1.44% is in line with my seasonality research.

Click on the chart to enlarge.
- $SPX data is from 1960 to 2010.
- SPY data is from 1993 to 2010
Calculations start at the open of the first trading day of the month and end on the close of the last trading day. No commissions or slippage were included.
November Statistics (using $SPX)
- Average Monthly Profit/Loss = 1.28%
- Winning Months= 63.46%
- Worst September = 1973 loss of -11.3%
- Best September = 1980 gain of +10.2%
Profit Distributions: (using $SPX)

Equity Curve: (Using $SPX)
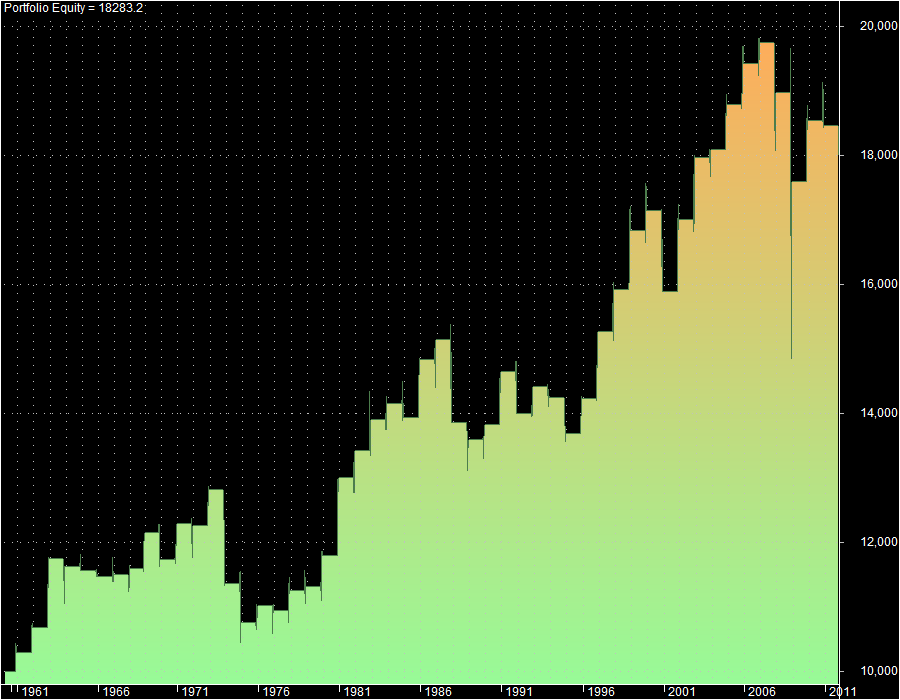
Over the past 50 years, November has been a reliable winner.


I think you can throw seasonality out of the window for November, it depends where the Eurozone wind blows …
Maybe, or probably. Still, these sorts of things tend to persist.