I was reading a post from EconomPic called Checking in On the World’s Greatest Rotation Strategy. This strategy is essentially just Sell in May and Go Away, but has one buy the Long government / credit bond index rather than just sitting in cash from May – October.
Oddly enough, I had never tested this simple strategy before, and the results EconomPic posted were good enough that I had to take a look under the hood to see exactly what was making this system run.
The Rules are simple:
- Long $SPY from the close of the last trading day of October through the last trading day of April.
- Long VBLTX (Vanguard Long Term Bond Index Fund) from the last trading day of April to the last trading day of October.
- First day of test is 6.20.1996. Last day is 3.29.2013. First day is first day of history for VBLTX.
- No commissions or slippage included.
The Results:
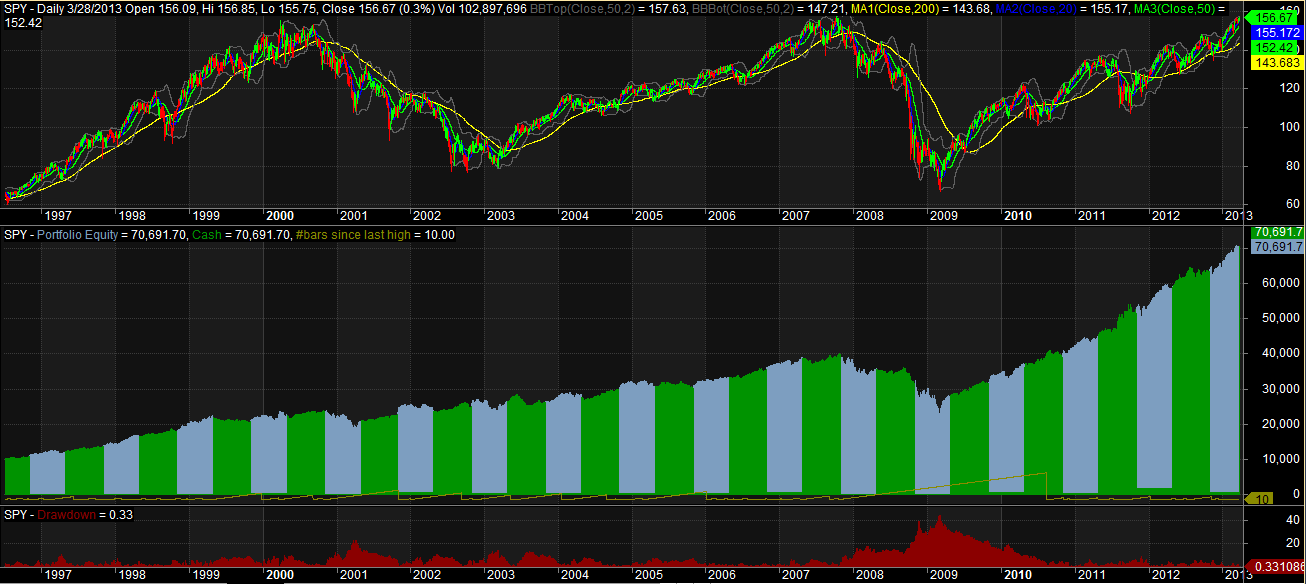
The top pane is $SPY. The middle pane is the equity curve for the strategy. The lower pane shows the drawdowns in percentage terms. The blue portions of the equity curve represents time in $SPY while the green represents time in VBLTX.
Statistics:
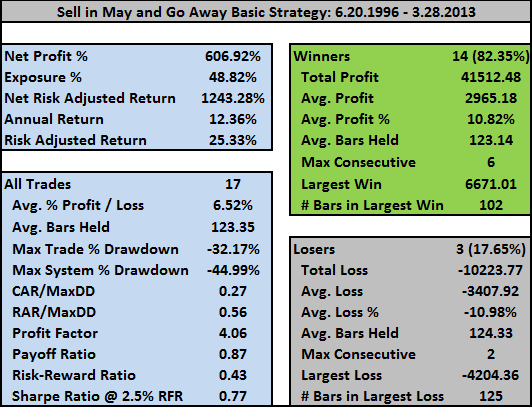
Because of the way I coded his, all the trade information pertains only to the $SPY trades. The returns from VBLTX are built into the overall returns but are not considered to be trades. Perhaps in future tests I’ll break out both $SPY and $VBLTX as separate trades.
If I subtract out the added return from VBLTX, the annualized return from just holding $SPY is 8.82%.
$SPY buy and hold over the same period is 5.26% with a maximum drawdown of -56.47%. So even if you do not rotate into a vehicle to provide a return on your cash, you still beat buy and hold just by selling in May.
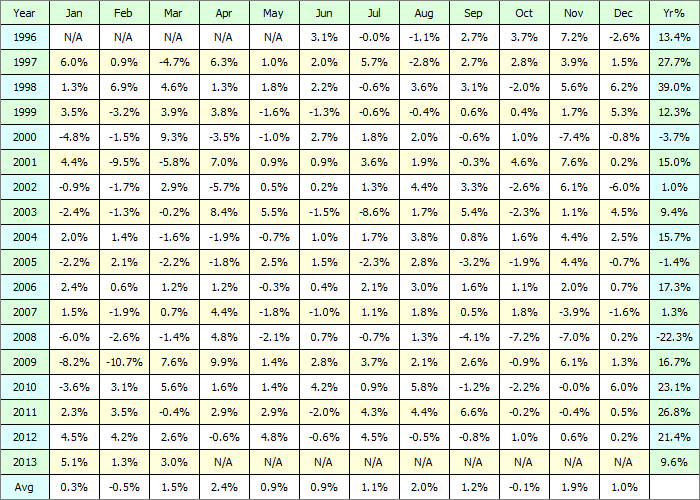
Historical Profit Table:
This strategy has just been killing it. I’m leery to assume it can continue killing it. Some questions:
- Assuming government credit / bonds do not continue to perform as well, with what would we replace VBLTX?
- Can we add additional robust timing mechanisms to improve performance of $SPY and/or VBLTX?
I’m looking forward to reading your ideas on these questions in the comments.
The next post will add in an additional timing measure for $SPY.


Sell in May and short sale the euro into European faces
I certainly can understand the skepticism about this continuing to work, but every year, we hear the financial press wonder whether this is the year the “Sell in May” trade finally burns those who get out in May, and year after year, it doesn’t happen. It can’t work forever, but trying to out-think it the past several years hasn’t worked either.
Totally agree.
Pretty neat plot, especially the last few years from 2009 where the bond portion is indistinguishable from the stock portion.
Checked a couple of papers on seasonal anomalies and was surprised the Sell in May effect wasn’t discussed, since I know it has been very well studied. Apparently the studies are in separate papers from the usual seasonal effects of December, January, holidays, and Mondays.
I might use VFITX, the Vanguard intermediate term Treasury fund, as a replacement for VBLTX. Lower returns but less credit risk. I suspect VBLTX has returns that are fairly correlated with the S and P. Or go the other way with high correlation and use LQD or HYG.
My feeling is few people can actually bring themselves to follow this strategy – and especially pension and mutual funds, so it should last a long time.
I’ll also note that the returns of the Dow, using sell in May, are somewhat different than the S and P returns.
Bozo, thanks for the suggestion of VFITX. I need to check on VBLTX correlation with SPY.
Interesting observation, re: people being able to follow, or not, the strategy. I can just imagine the pension/mutual fund mgr. saying, “You’re going to pay me to manage your money but for have the year I’m just going to park it in bonds.”
I’m going to run the DOW right now instead of SPY and see what that looks like.
Bozo, I just ran the DIA from 1.20.1998 and don’t see much different from running SPY?
That’s interesting. My comment was based on a table in Kaeppel’s book that I mentioned previously. Looks like he uses the starting year in his chart, while you use the ending year. But there is still a large discrepancy for several years. I am going to try and duplicate his data. Recall he claimed 17.1% annualized; sounds too good to be true.
Nice little study. Only thing that comes to mind for improvement is some sort of breadth reading…
You get almost 20% during 1991-2011 if you use some Fidelity funds (FSESX, FSENX, FSRPX, FSRFX, FSCGX, FSELX and FSCHX) instead of SPY. You can back test going back to 1991 if you use VUSTX instead of VBLTX.
You reduce the annual losses in the losing years (esp 2008) if you buy on the last trading of November instead of October.
Gregor, you probably know I really like fidelity funds. How did you choose which fund to be in during that time?
Also, I’ve found that FLBIX tracks VBLTX fairly well.
I think there are many ways we could slice and dice when the actual buys and sells are made in terms of the first of the month, end of the month, etc. but I’m hesitant to go there because of curve fitting.
I think there are other tweaks that probably will improve it without curve-fitting.
My original exposure to seasonality was this article on seasonality in FSESX:
http://seekingalpha.com/article/184707-an-amazing-energy-services-seasonality-trade
The other funds I chose are essentially representative of the Tech, Retail, Industrial sectors and the broad market (FSCHX is most of the time like SP500).
That’s where the idea of getting back at the end of November originally came from. I agree that it does not make sense to optimize with respect to the various parameters as it would make the system very fragile.
I think there needs to be some evaluation of bonds as an appreciating asset class going forward. There was some blogoland chatter a few months ago regarding the “max theoretical gain” left in bonds (forget if it was the 10yr or the 30yr) and that number being around 17% total net or so (IIRC). Sentiment seems to be that given the current interest rate situation the only direction rates can really go is up, which translates into “bonds down”.
Me, I’d be wary of the forward usefulness of any methodology incorporating bond longs that has good backtest results. .
KTB
A couple of more filters for you to consider = code for mean reversion (if market is already negative for the year, dont rotate or if May was a down month say 4% of more, dont rotate – this works greate especially when you use the MAvg with the strategy.)
I meant if March is down month – not May… duh