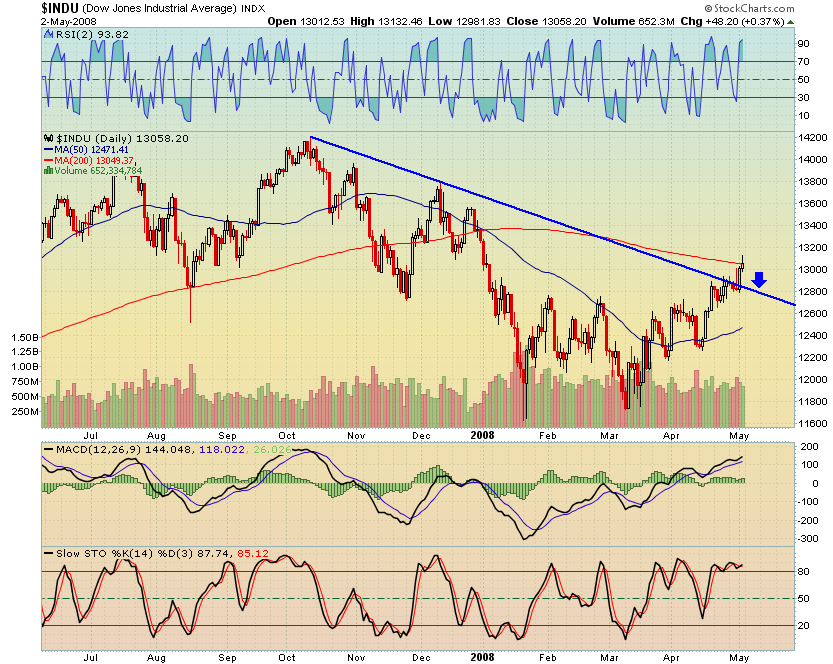
Its hard to not be bullish, when looking at this Dow Jones chart. The index has decisively closed above its downtrend line, and breaking firmly through the 200 day average looks looks easy now.
By almost any short-term measure, the index is overbought. A pullback is to be expected, but because of the recent strength, there may be a day or more of continued grinding before it occurs.
Incidentally, the strategy that I am testing which uses RSI(2) as an entry trigger has signaled a buy at the open of DXD, the double inverse Dow ETF.
I am going to watch for a test of the downtrend line. I also want another close above the 200 day average.


You are a true chart addict. Interested to see what you come up with.
I would hold off on [[DXD]] for about forty eight hours.
I’m seeing a Bull Flag and a pretty strong signal too.
But I’m being beat in the polls by BEAS & hattery so what do I know?
Too late Laughing Crow. I took the signal and bought on the open. My suspicion is that the exit signal will be given tomorrow, and I’ll exit Wed. a.m…. Of course, that plan could always take a skid…
I like it … Laughing Crow is a great name.
The meaning of the name is literally “Crows Laugh” but when I signed up to a certain third tier blogging engine, that name was already taken.