IBDindex has posted some new research on an RSI(2) strategy.
Read it here: Trend Following RSI(2).
The results have me extremely excited about building a system around this simple strategy.
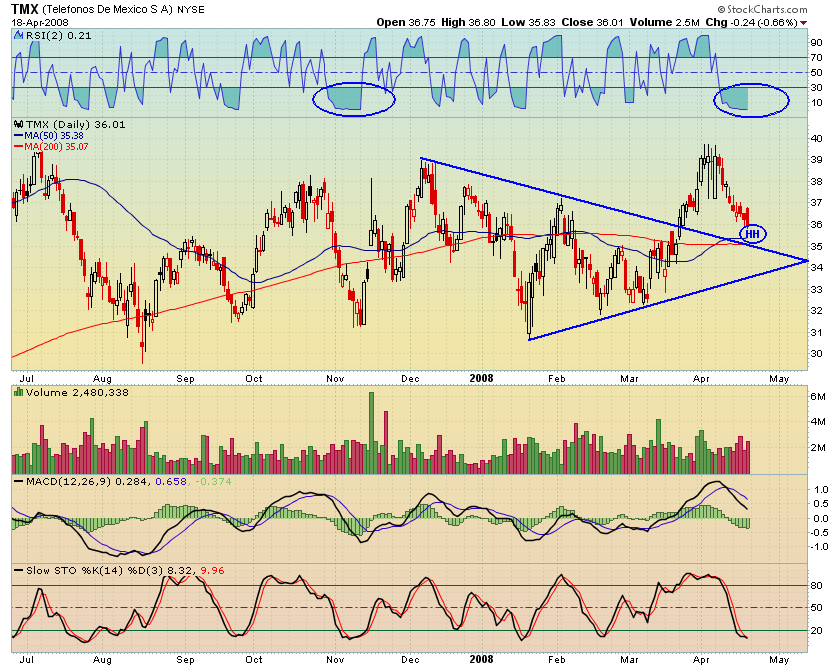
Below is a chart of [[TMX]].
Note the RSI(2) is .21
A simple play is to buy [[TMX]]Â tomorrow and sell it when RSI(2) > X (You might use between 75-90). I like this particular stock because it has been oversold for several days and it may be sitting just above support. Be careful though, as earnings is Tuesday the 22nd.
If you buy [[TMX]] because of this post, it may stay oversold for the next 13 days, and result in a severe debanking.


I’ve realized in my trading experience that the share price % above and or below the 200 dma does have an impact on the % return over the next 1,5,10 days.
Nice choice.
http://stockcharts.com/charts/gallery.html?tmx
Looks like the p&f is suggesting 54 but two things I noticed on the charts the link has.
1. CMF is showing that money is slowing down. If you hold your peace you might be able to get a better deal (I know the whole idea is to test the RSI2 but anyways)
2. The PPO on the weekly chart verifies a price downturn.
http://stockcharts.com/h-sc/ui?c=TMX,uu%5Bh,a%5Dwaclyyay%5Bpb40%21f%5D%5Bvc60%5D%5Biue6,12,9%21lj%5B$spx%5D%5D
I have not yet placed an order on TMX because of Wednesday’s coming ER.
Good charts, cuervo. Did you get my email?
TMX = 1/1 = 100% Just stop now and start a newsletter 😉
They have telephones in Mexico?
Yeah, perfect score!
Actually, I had several other profitable trades from this strategy earlier in the year and late in 07. ECA and GFA were two that I remember.