Advancers led decliners by almost 3:1 today on the Nasdaq and almost 5:1 on the NYSE.
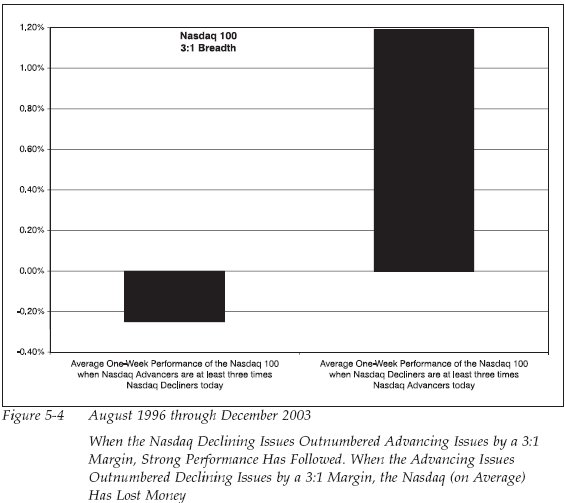
In the book How Markets Really Work, tests run from 1989-2003 show that a bullish advance/decline ratio is actually bearish for the markets over the next week.
Here are some charts from the book that illustrate the quantitative disadvantage facing the bulls over the next week:
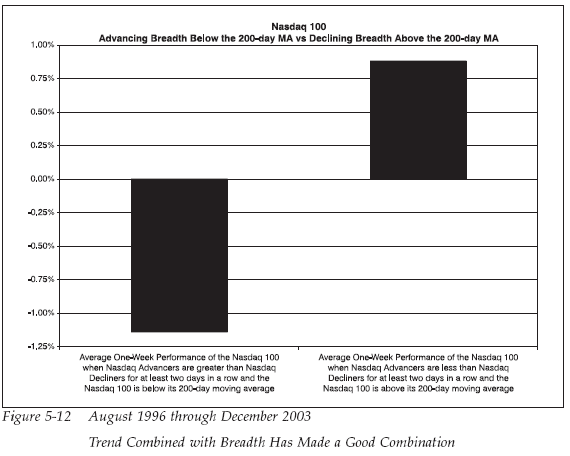
The chart below shows that the A/D combined with the 200 day MA points to the possibility of even more downside, over the next 5 days.
Be aware that I have not seen the results of these tests over the past 5 years. Any edge may have been diminished or eroded entirely over this time period.


updated the time on my last post so you could stay on top for a while.
Where are my index charts? I need to find the honey hole.
Thanks Cajun.
I can sum up the index charts for you: nearing short-term overbought. My suspicion is that they reach overbought again, right at resistance, maybe as early as tomorrow, and reverse. You would want to buy the pullback, as you have over the past month. I’d say next week you’ll be able to get a 1-3% discount if you time it right. Today was very bullish, and while I added to existing long positions, I’m not initiating anything new until I see some weakness.
does this include days preceeding subsequent numerous 3/1 or 5/1 up days? or just the last of a run of them. oh.
wondering,
They test over 5 days after the event occurs.
For example, during the test period, any given day with +adv and -decline, 1 day in a row, provides very slightly bearish conditions over the next 5 days.
They also tested +adv vs. -decline after 2 days in a row, 3 days, etc. Over the next 5 days, the indexes typically decline.
The markets were already overbought before yesterday.
71% probability of correction is now 99%.
Based on the whole Normal Distribution, which accounts for about 65-70% of the market moves.
Wood, you might be interested in this book as it gives the reader a walkthrough on creating mathematical models of random games. In specific, the author (a CSUNY professor) details how he went about creating a jai alai betting system.
http://www.amazon.com/Calculated-Bets-Steven-Skiena/dp/0521009626/ref=sr_11_1?ie=UTF8&qid=1208430911&sr=11-1