The biotech “bubble” is about to explode in your face, are you ready for it?
Across the other sectors we have a lot of things going on – Rails (Transports) are getting annihilated (which was expected and posted here 3 weeks ago) along side the obvious Oil/Energy raping we’ve seen (also posted here, two months ago). Banks are doing absolutely nothing thanks to the Fed meeting this week, so the jury is still out there. While Consumer Staples, Industrials and Consumer Discretionary are well off their recent highs, and selling volume is escalating after the low-volume rally.
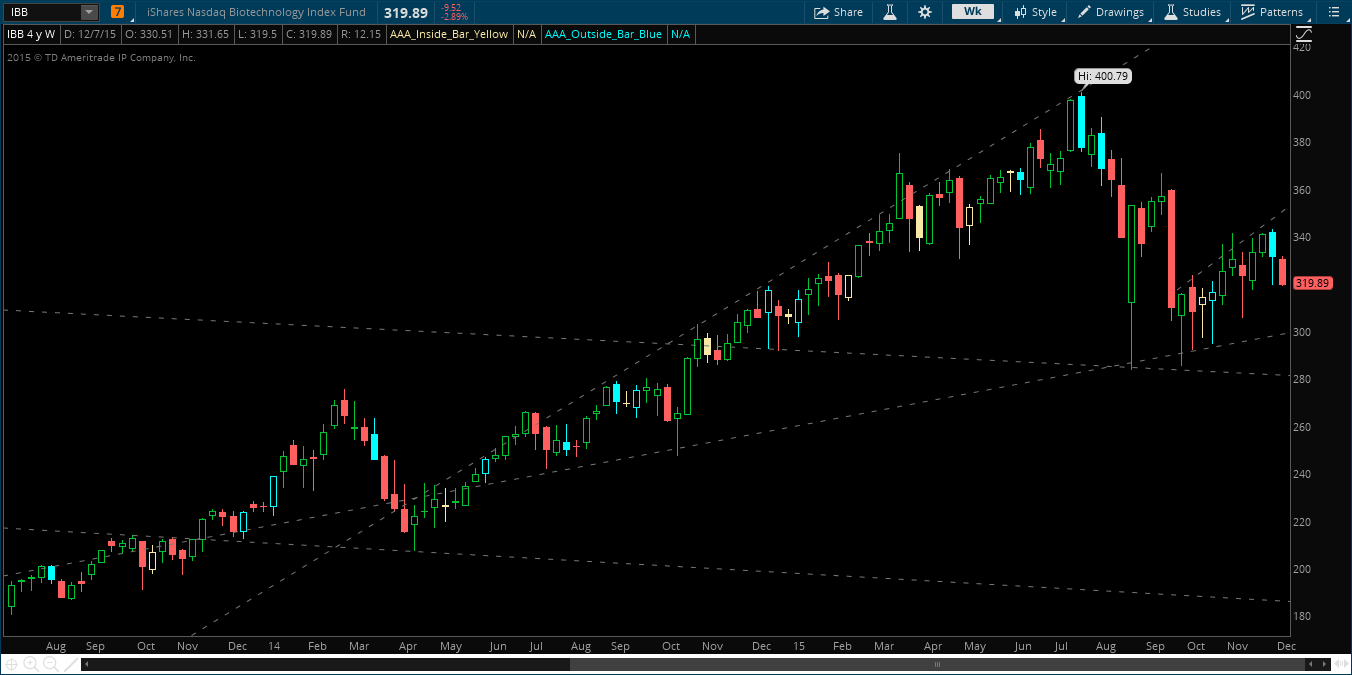
This leaves us with the lowly Biotech stocks, not really doing much of anything. Friday’s close of 320 puts us right at the same price we were trading at in August. If you look at the weekly chart (below) you’ll see a very slow creep higher, making slight higher-highs week after week, but no strong rally like we saw in the broader markets. Clearly, Bio’s are hanging on by a thread, and if you blink, you may miss a great opportunity to cash in huge.
If we bring the chart out a bit and take a look at the monthly chart, we really start to see a great picture of the potential magnitude of what could take place over the next few months – and it looks bad. As we posted in October, the down move we saw in August was the first domino to the potentially fatal blow the markets. Over history, we see that these moves are often retraced 100%, and then the original move continues with authority (also posted here).
Therefore, if we take a look at the price action, we have a massive move brewing over the next few months. As we know, stocks trade in a series of broadening formations, and that outside bars represent fractal triangles and serve as high/low-end targets. Therefore, if we complete this monthly broadening formation, which is supported by the “measured move” theory, we have an absolute liquidation in the biotech sector on the forefront of 2016.
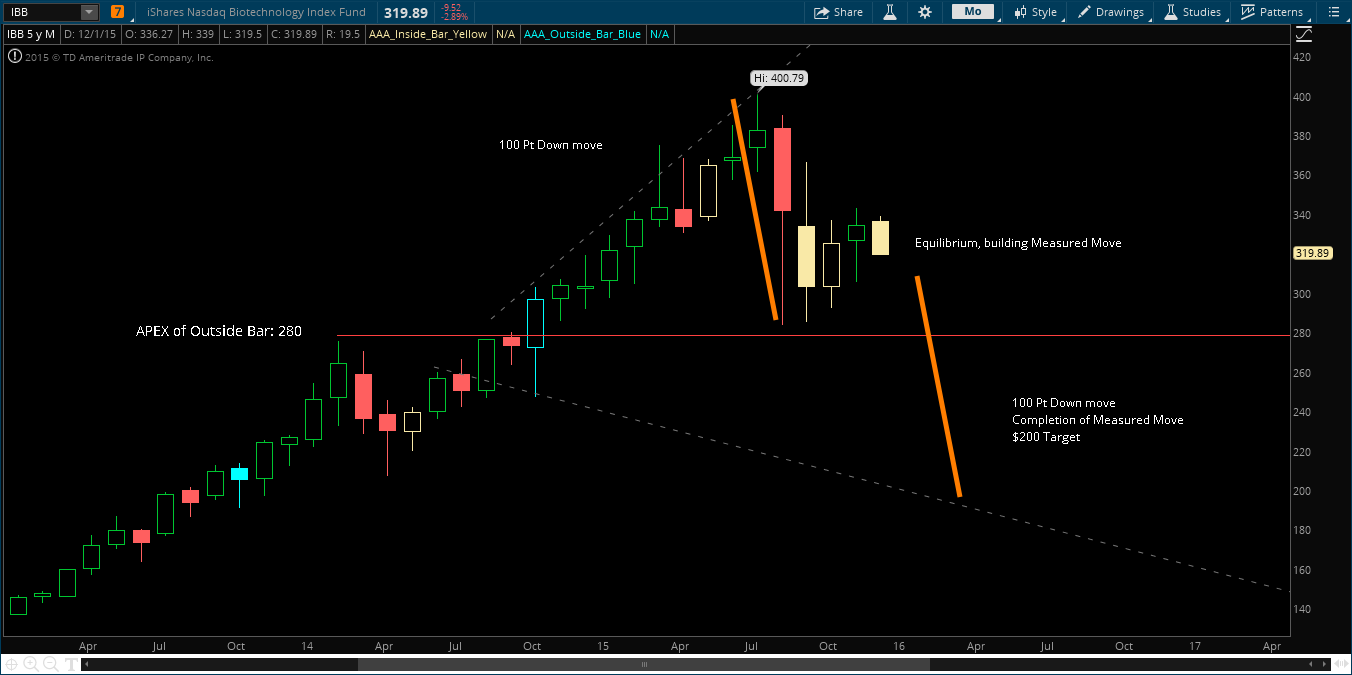
If we take it level-by-level we have some key areas to note. First, the APEX of the triangle is 280. This will most definitely serve as short term “support” if you will, and will be our first target if we break down below 310. It’s is safe to assume we’ll see a stall out around 280, as the APEX of at triangle sees the most volatility. Below 280, however, we have smooth sailing down to 220-240 range.
The question here is how do we play this? It’s a tough answer to muster, because capital constraints, time frame, and timing all are major factors. For those of you that have capital limitations, look into the inverse ETFs (BIS for example). As IBB is so expensive and volatile, I believe playing this with options is very effective. If you have margin, selling the calls will be paying very huge. If not, you’re timing needs to be very good, as buying naked puts will be the way to go.
Stay tuned for our updates, because this will be a heavy focus over the course of the next 1-3 months.
If you enjoy the content at iBankCoin, please follow us on Twitter


Too obvious and too many positive tailwinds in their favor. I’d expect prices to start tracking higher again especially when polling shows Trump over Hillary for the general election.
We shouldn’t be trading based on expectations. We should be trading based off of the analysis of price action.
Excellent post homie.
Thank you
I think your analysis is missing a very important part – the volume. October volume was so insanely high on that huge green candle. The highest volume ever in this ETF. If you look back such huge volume marked bottom every and each time.
Another fact is that while IBB lagged during the recent bounce it is actually POSITIVE for the year (surprise… I know). Now how many sectors are positive for the year? So you want to short on of the strongest sectors this year?
What if I told you that come January and IBB might explode another 100%… I am going to trade BIB. Loading up the truck early next week.
Two things:
1) Price dictates volume. Had the volume been consecutive/consistence buying pressure, the price would have risen. Not to say that buying may step back in, but technicals are not showing that.
2) Past performance is not indicative of future price.
What if I told you IBB might not explode 100%? I’m not sure where that was going…
At the end of the day, pure technical analysis of price action is what we should be looking at. If we run to 350, that monthly chart looks very different. If we don’t, it looks like crap. Trading, at the end of the day, is an If/Then scenario based on price action.
Thanks for the comment, though. I do love the banter/feedback.
Great post man, I am not one who trades based on technicals, but I can appreciate the consistent analysis and the framework (which to me, is the most important aspect of being a participant in the market, no matter the strategy or framework).
As a side note, how are you playing this? Have you positioned yet?
Thanks for the constructive feedback! Don’t be afraid to come to the darkside and trade some technicals! 🙂
I haven’t played any Bio’s as of yet, I do want some exposure to the short side but haven’t found a great entry. Ideally I’d get a sell signal back around 325 in IBB, if I don’t get it I’ll definitely be short by the time IBB gets to 300.
Sell signal happened today around 330 – did put some small exposure on via January Puts. Goodluck to ya.