Monday morning kicks of today with a slow bleed in the morning, as traders still await some form of clarity. If we look at the SPY daily chart, we can see that we are going outside/outside day, after the inside day last Wednesday. In effect, the markets haven’t moved since November 18th
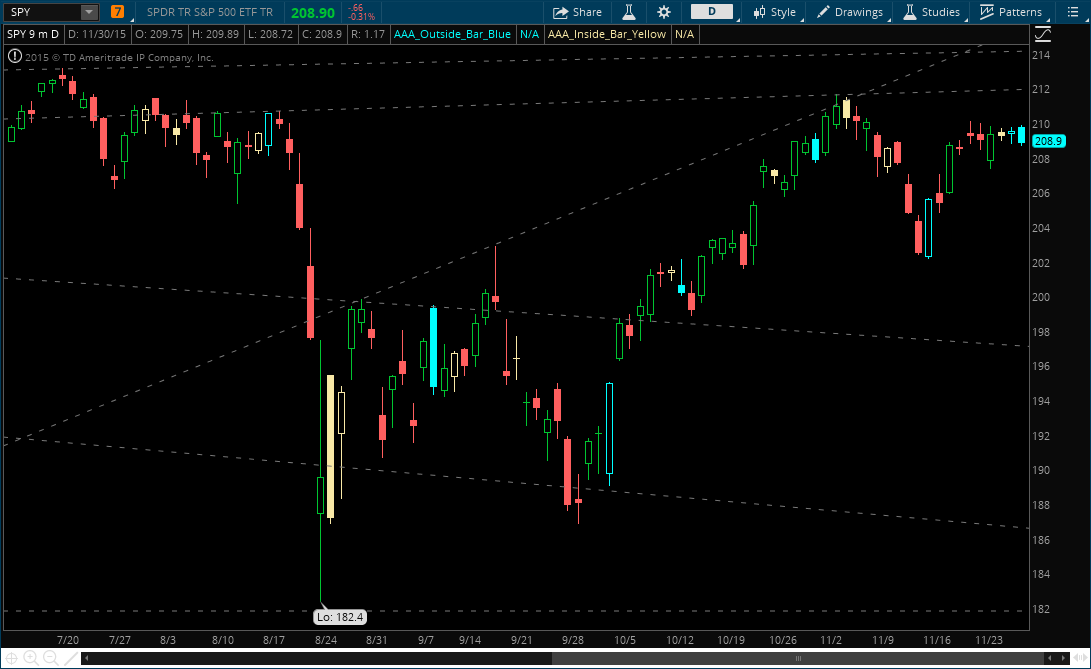
SPY Daily Chart
That being said, however, during periods of low volatility you can still slowly position yourself according to your thesis. If you believe the market is going to go up into the end of the year (as I do), you have to focus on getting the best price possible. Buying the highs and the potential “breakout” is not a conceivable plan when the market volatility has dried up. I hate the term “buy the dip,” but in essence you have to test small positions as markets fall into support (or rise into resistance if you are bearish). Whenever you are buying into support, it’s imperative to keep a tight leash on your positions and never let these short-term trades become long-term lovers.
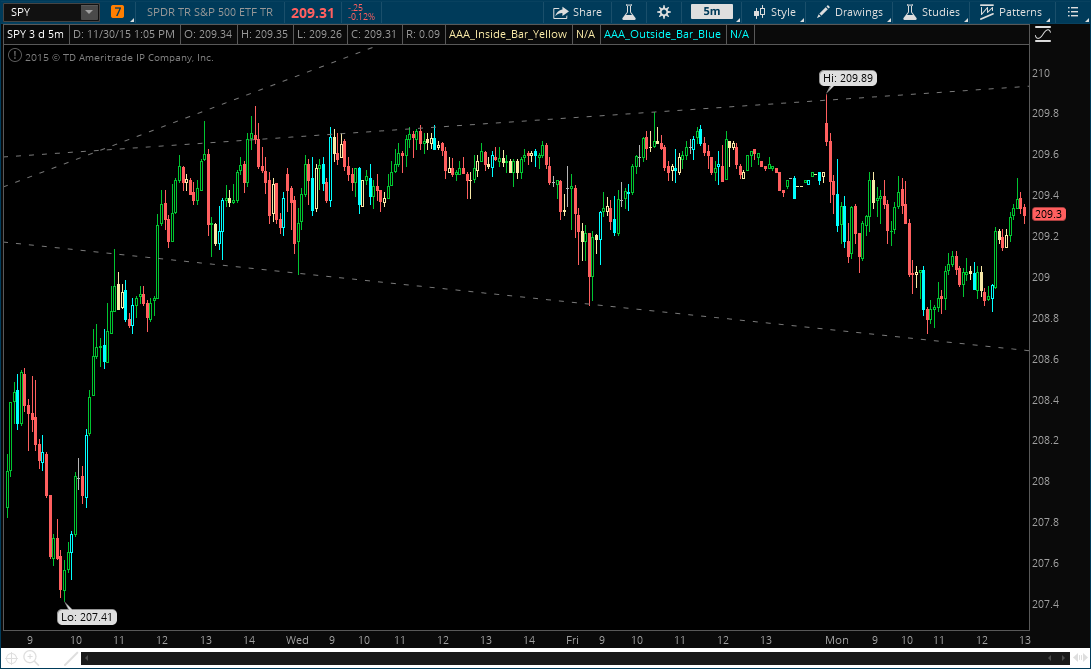
As such, let’s look at the 5-minute chart from this morning. We fell into support around 10:50AM, providing you a solid risk/reward scenario if we held above 208.50 or so. Here I did get long the SPYs for a trade – moving my stops up to break-even. If SPY holds 209 for the day, this may provide a key level to hold swing positions against.