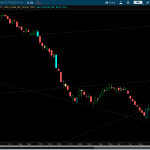
To start, the ES Futures are inside day today and it is something you need to know about. If we break higher, we are green on the day and the week, a small positive as we’ve seen relentless selling on any rally. And believe me, I want us to go higher — a short-covering rally will pay very well. If we break lower, we have full time frame continuity to the downside and we have the green light to press shorts. Below 1825 we start to get heavy VERY quickly. As I’ve said for weeks now, the February lows are VERY important.
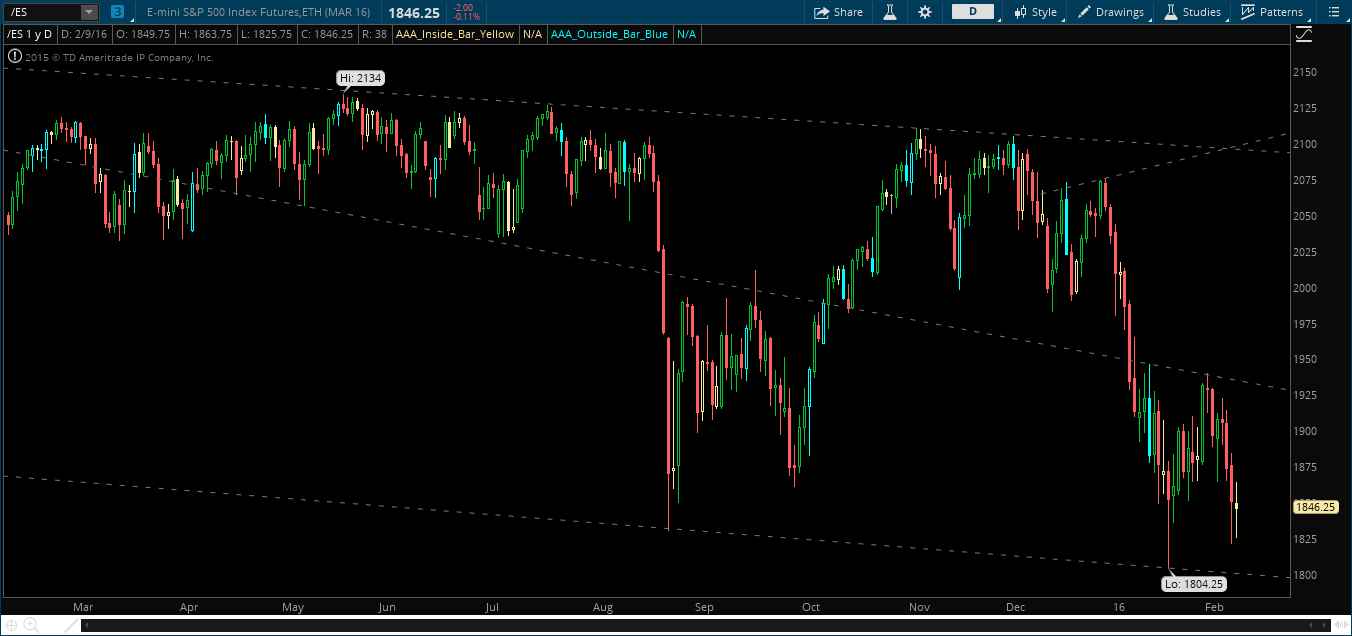
Tomorrow we also have the oil number in the morning, and seeing as we have already taken the inside week to downside, this could just add to the drubbing that we’ve seen this year.
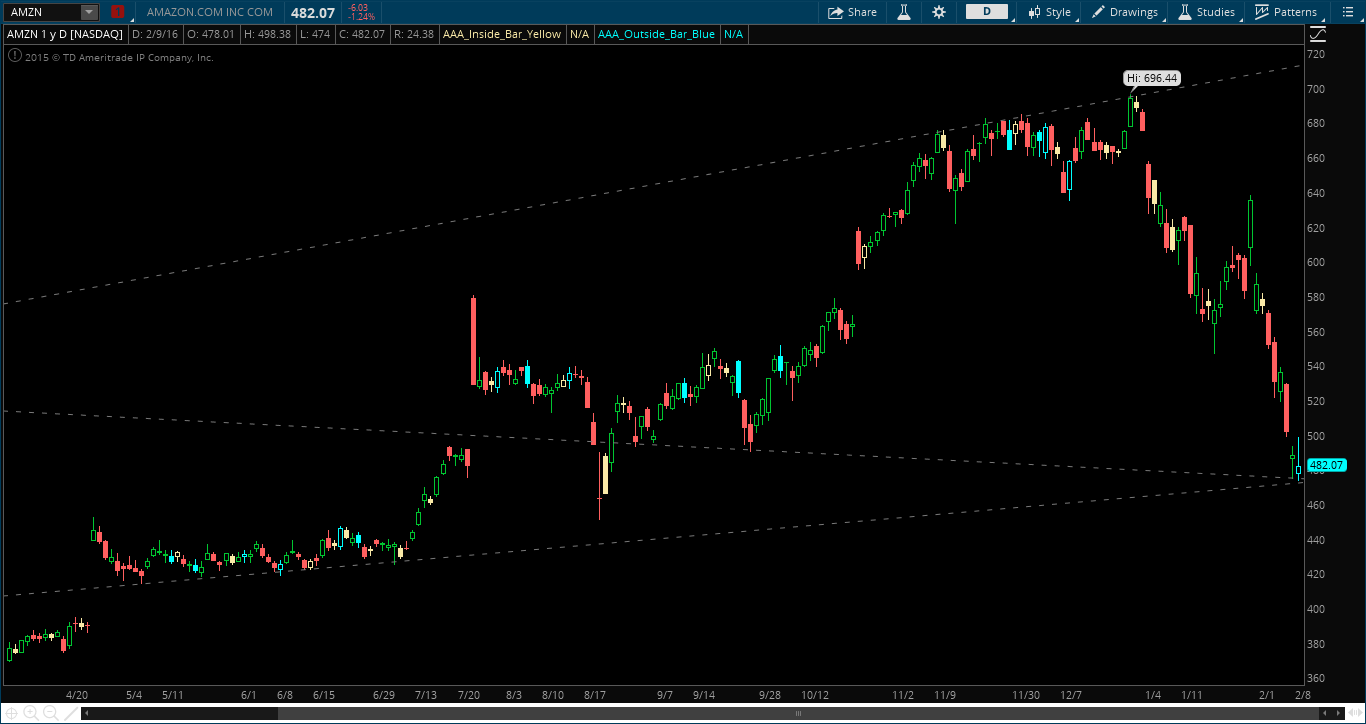
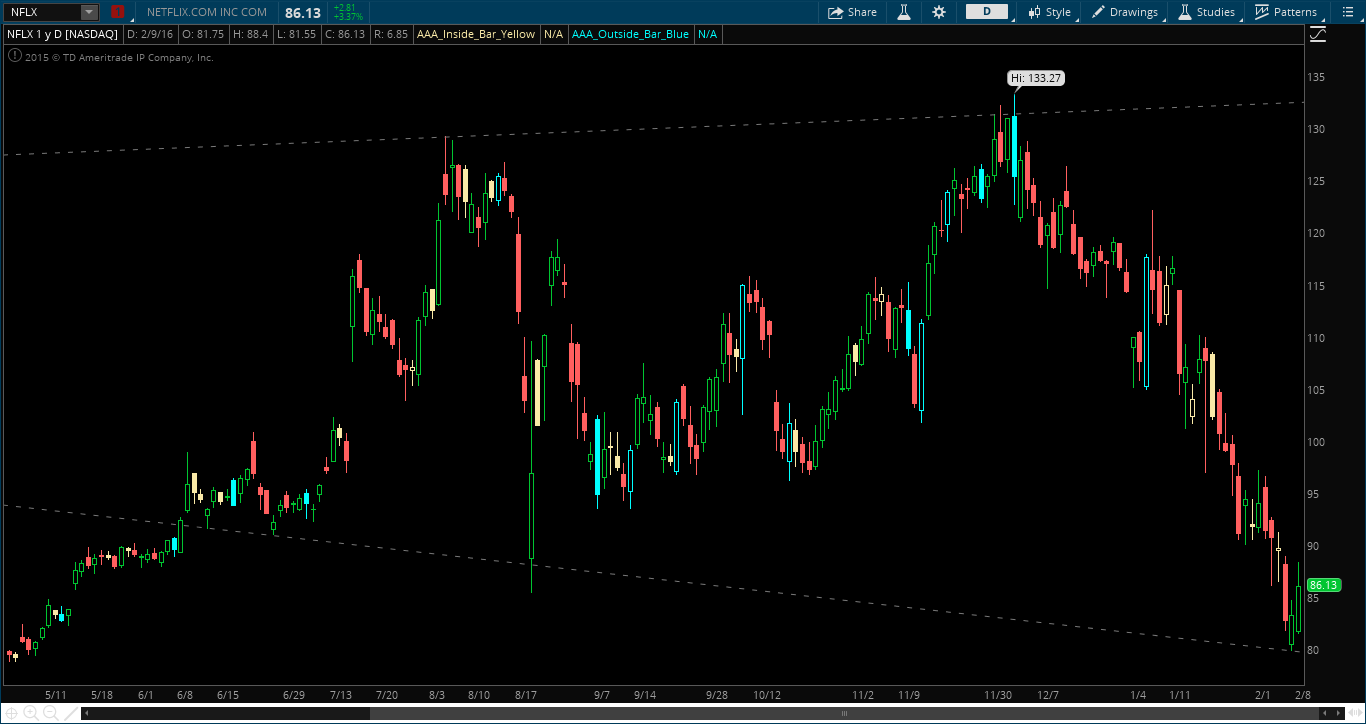
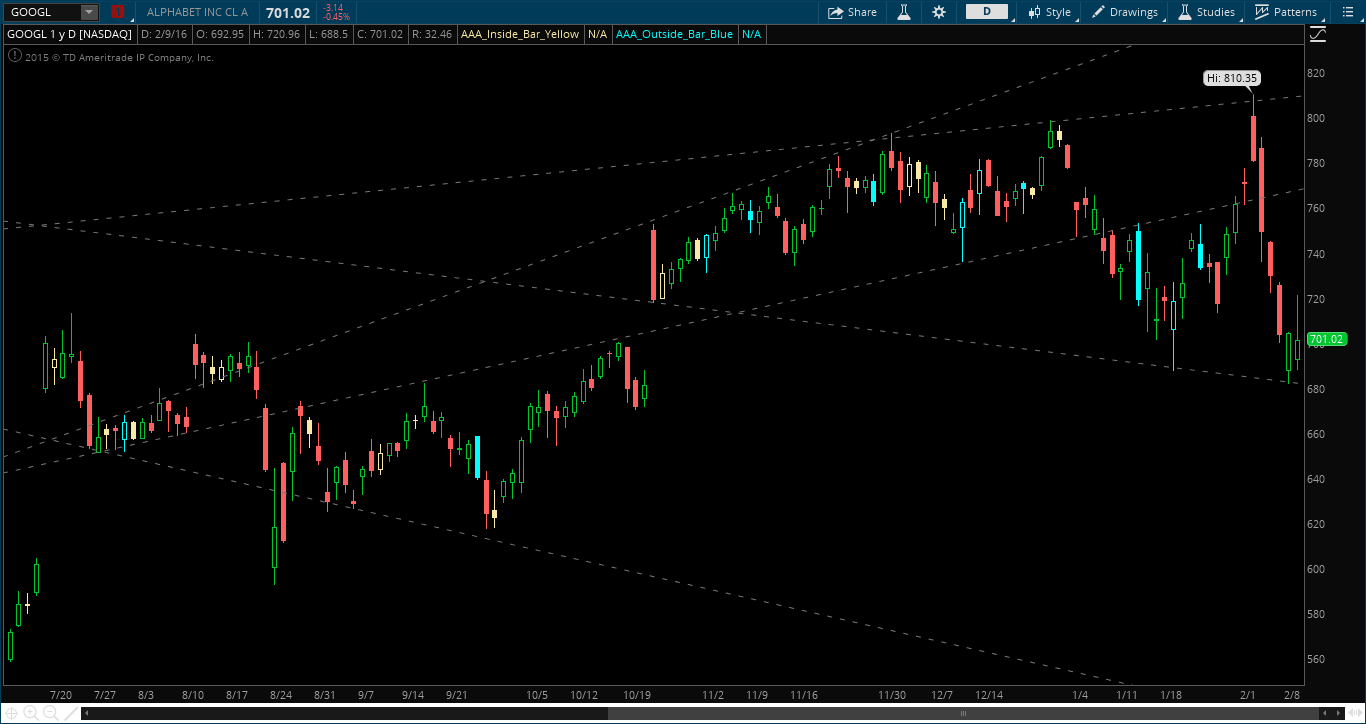
If we delve into the internals, it just gets worse. All high beta stocks closed well of their intra-day highs, putting in shooting-star candles on the daily charts. Yes it’s only one day, one afternoon sell-off. But it makes for holding positions overnight a complete crap-shoot.
If we look at the major sectors, absolutely nothing looks compelling. These charts are garbage. Even more, we are seeing the Utilities even starting to lag. If they stall out, this will be a “baby with the bathwater” sell-off in the coming weeks. Transports are hanging in there, but no reason to buy anything. Biotech’s are trying to hold on to support, but we have no evidence that will hold. FAS Financials just look like they are waiting for a reason to get annihilated, and another break below the 18 level might do the trick.
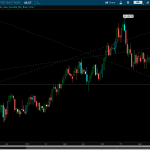
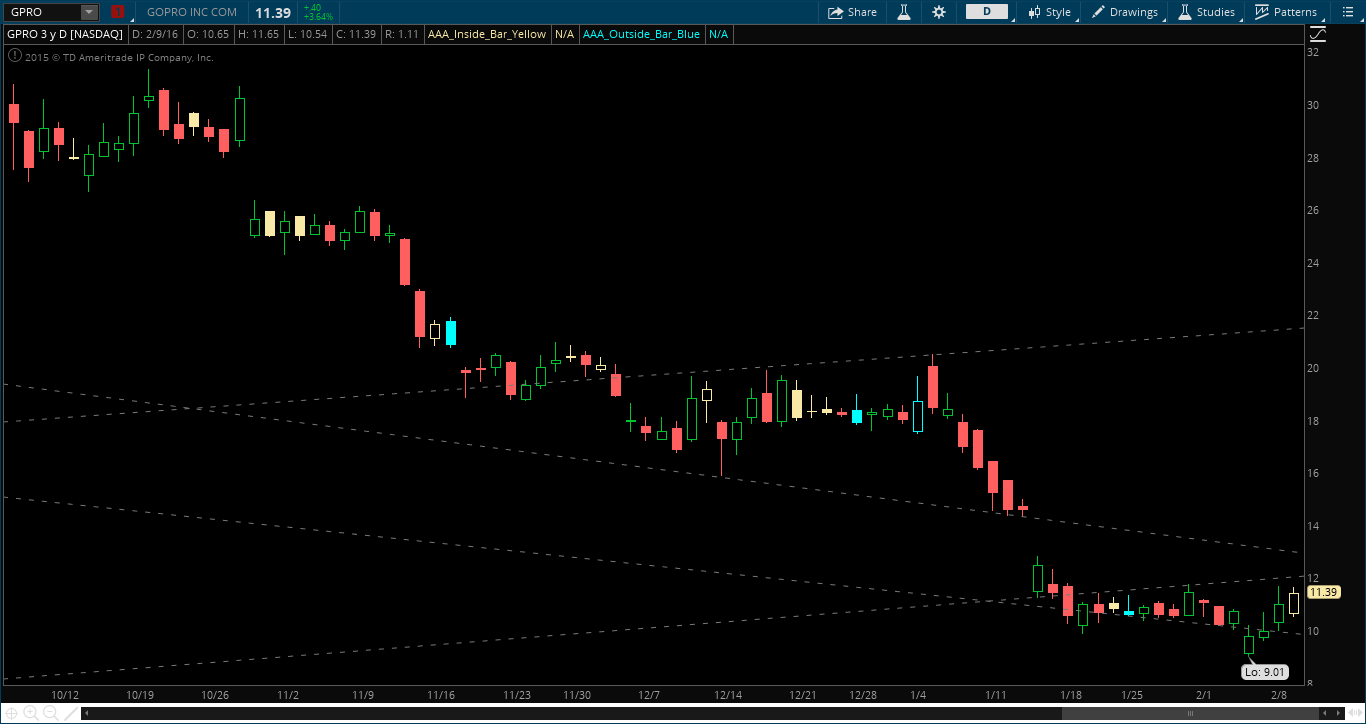
You know this market sucks when one of the the charts that I actually may trade long is GPRO:
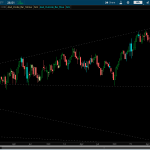
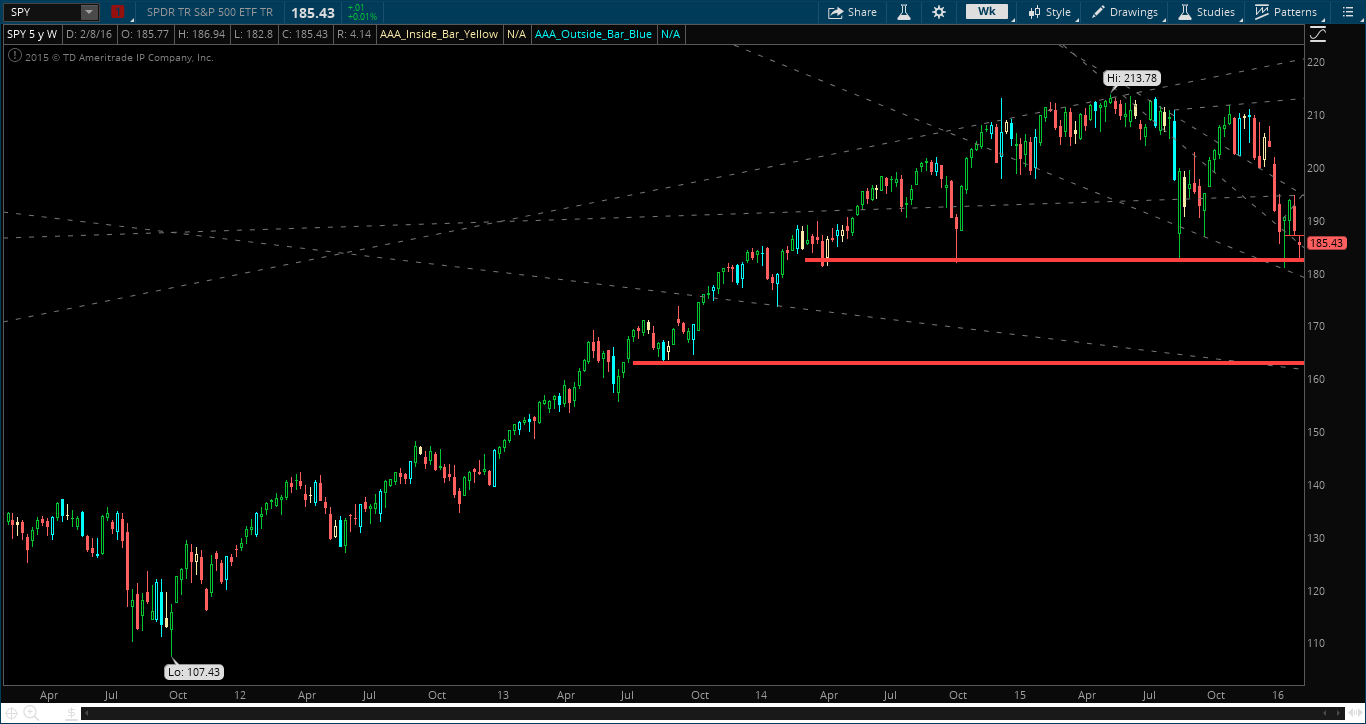
I’m not trying to be the bearer of bad news, but if you look at some of these weekly charts, it really looks like the recent sell-off in the last month or two is only HALF of the move to come. If we don’t bounce soon (calling on you Janet), the shorties may really be licking their chops. After all, time frame continuity tells us that we are lower than we opened on ALL time frames. If we were to sell-off, this would be the case when it would happen. Short-term advice, keep things small to the long side – every rip has been sold. We may bounce over the coming weeks, but all in all it looks like it would just be setting us up for the wipe out move down to 160 in the SPYs eventually.


One comment
Pingback: Destruction is Coming Soon | Varel Research