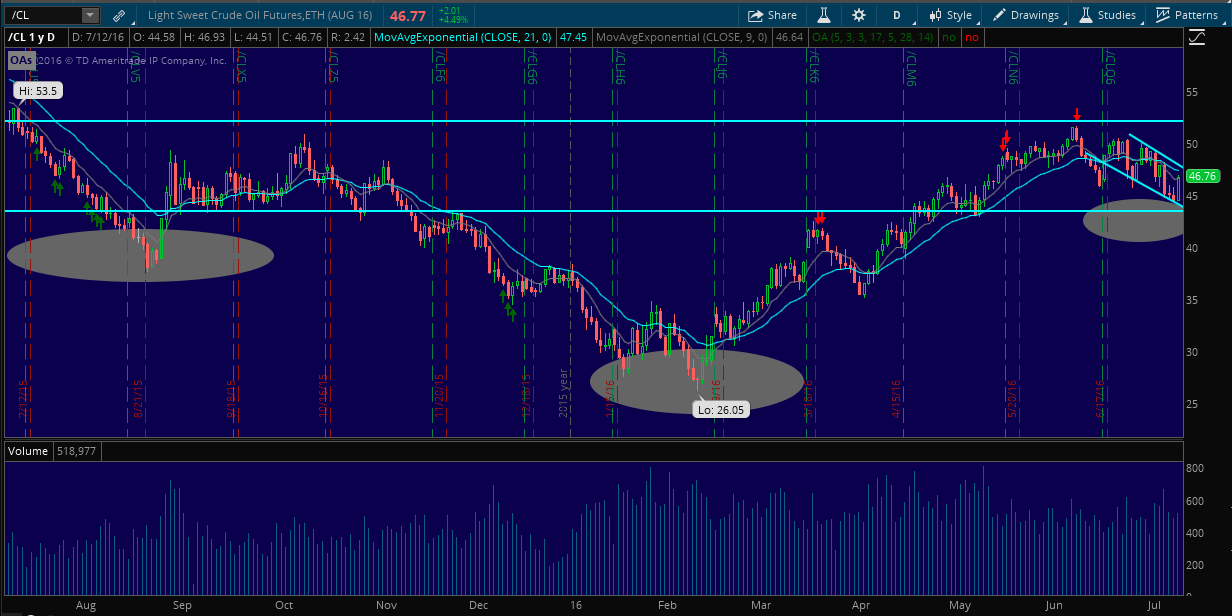
Since the end of May, Crude has been rangebound trading between $44 and $52. The daily chart below shows the current range along with an inverse head & shoulders pattern that is setting up:
 __
__
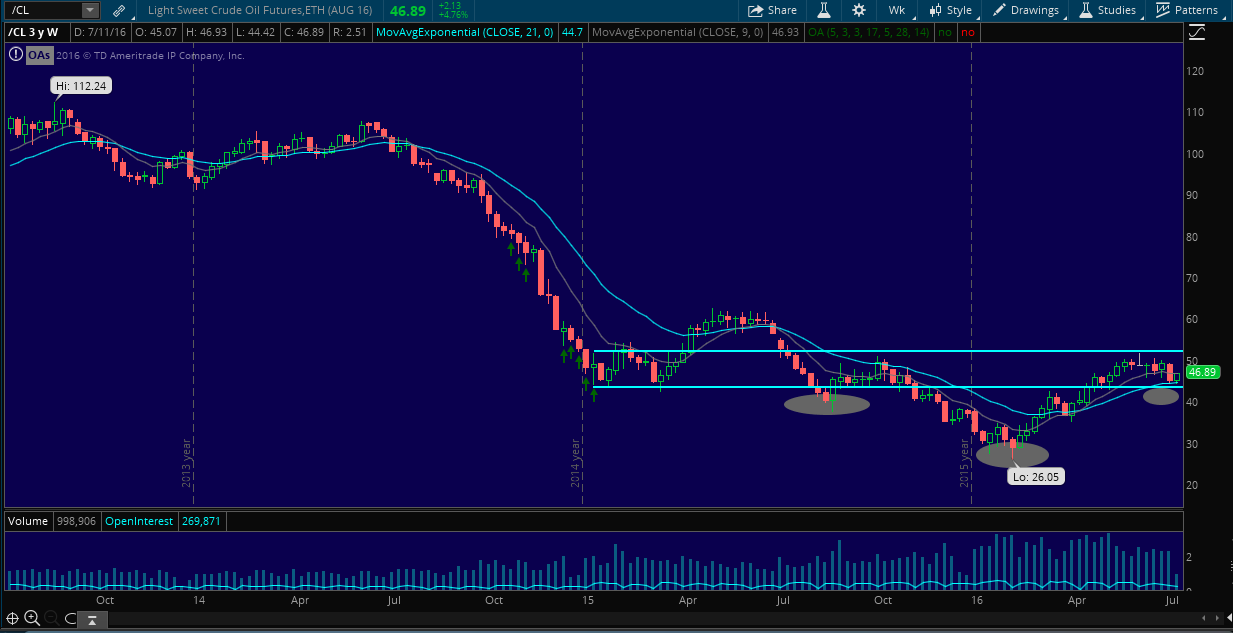
The weekly chart below shows the potential to be long crude should prices get back above $50/barrel. There is nothing but free air up above which should suck prices higher, should we trade up there.
 __
__
I have my eye on the industry here.
If you enjoy the content at iBankCoin, please follow us on Twitter


Same H&S formed last year in the summer also, and failed.
The fundamentals and USD (fed-speak) make technicals only a loose guide.
Crude should begin the waterfall lower this month that will take it into the low 30s again by EOY
indeud. Would not be surprised to see that happen. So far though, I like the way oil has been holding gains here.
+1
Find something to short that hasn’t already crashed. Just my two cents…you’ll thank me later.