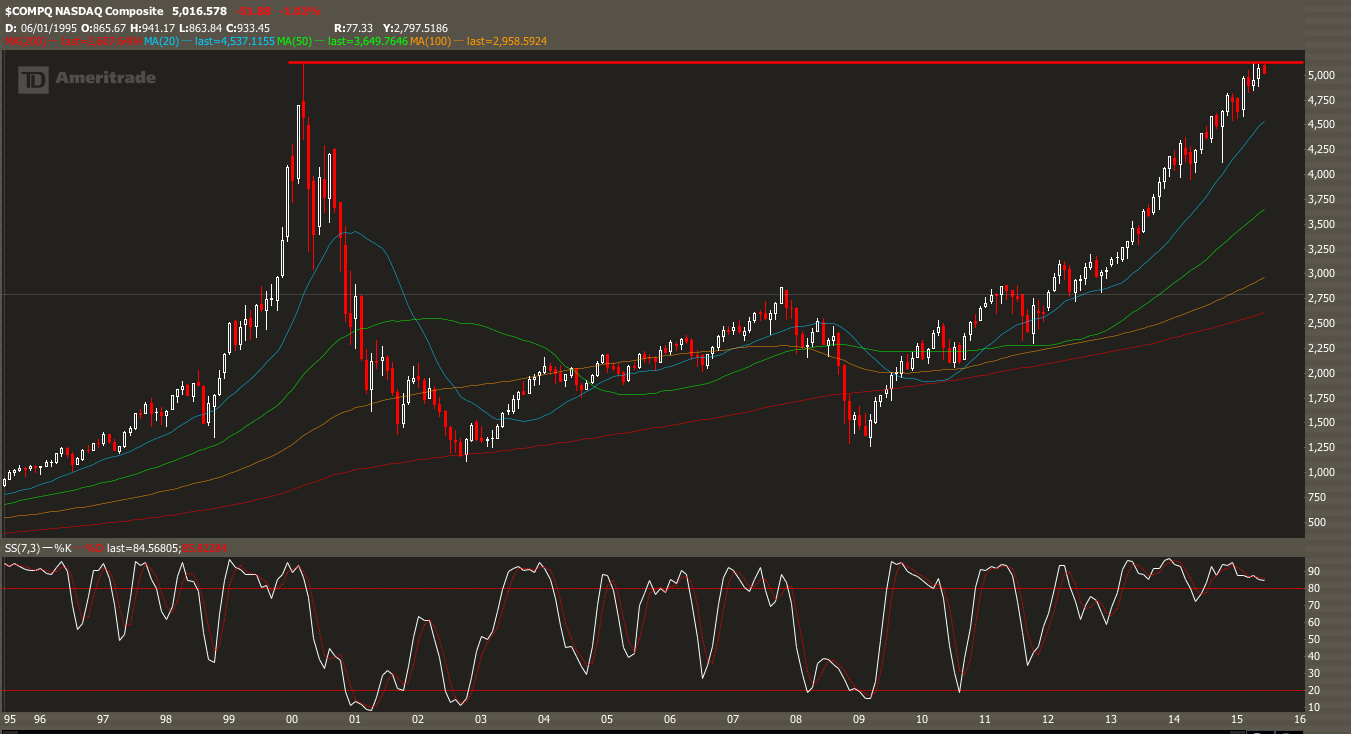
The Monthly chart of the NASDAQ has been floating around all weekend, with so called “experts” claiming for a double top of epic proportions. I, myself, find it pretty amazing that we were able to make up all the lost ground since the tech bubble back in 2000. Here’s a look at the monthly chart:
 ______
My question to the iBankCoin nation is this? Is it time to start selling stocks and prepare for a deeper correction, or it this just another dip that we should be looking to buy? Vote below:


Hide yer womens and chldrens
At that first peak, Apple was about to go bankrupt, most people didn’t have a cell phone, Amazon was a book store, Google didn’t exist, Zuckerberg was in high school, I was on Friendster, and gas was 99 cents. Now Apple is going to be a trillion dollar company, everyone has a computer in their pocket, Elon Musk wants to colonize Mars, Facebook is making real billions, and Amazon can bring me a pair of $200 headphones by 5pm today if I click this button. We are going higher.
Nice commentary!
Well said
bullish!
Another excellent iBC post.
I know now that the market is due for a correction. -8% is all I need.
You can’t equate the 5000 Nasdaq high in 2000 to the price now, since with inflation that’s equivalent to 7100; its going higher
I just like the helpful information you provide to your articles. I’ll bookmark your blog and test once more right here frequently. I am rather sure I’ll learn lots of new stuff proper right here! Good luck for the following!
Hello there, just became alert to your blog through Google, and found that it’s truly
informative. I am gonna watch out for brussels.
I will appreciate if you continue this in future. Numerous people will be benefited from your writing.
Cheers!