This relief rally idea is getting old. They all turn into bear traps.
Comments »Monthly Archives: October 2011
Asian Markets Trade Mixed, Europe & U.S. Futures Up on Relief Rally
Jim Cramer’s Mad Money Monologue, 10/4/11
[YouTube:http://www.youtube.com/watch?v=kMTDAc3y6Gk&feature=youtube_gdata_player 603 500]
Comments »Old Man Buffett Plays it Cool with BofA
Billionaire investor Warren Buffett is not concerned by the sharp drop in Bank of America Corp shares in the last couple of days, despite his $5 billion investment in the company last month, he told Reuters Tuesday.
“We agreed to hold it for at least five years, so what I’m thinking about is where Bank of America will be in five years, and nothing in the last 24 hours or 48 hours has changed my views on that,” the Berkshire Hathaway Inc chief executive told Reuters on the sidelines of Fortune magazine’s Most Powerful Women Summit.
Comments »Oil Futures Rise in Asian Trading
Benchmark Nymex light, sweet crude-oil futures CL1X +2.68%advanced $1.94 to $77.61 a barrel in electronic trading during Asian trading hours Wednesday, taking back some recent losses. Crude-oil supplies fell by 3.1 million barrels for the week ended Sept. 30, the American Petroleum Institute reported late Tuesday. Analysts had been expecting supplies to rise, according to Bloomberg News. Oil finished below $76 a barrel for the first time in more than a year in regular New York trading Tuesday, pressured by worries about Europe’s debt crisis and the outlook for U.S. economic growth. “Oil prices remain under the sway of macroeconomic sentiment,” noted strategists at Barclays Capital.
Comments »President Co-Caine Starting to Resonate
Herman Caine, mathematician, former Deputy Chairman of the Fed, is now a contender for President.
Comments »Today’s ETF Winners
No. Ticker % Change
1 TNA 15.27
2 DRN 12.79
3 UWM 12.68
4 SOXL 12.67
5 MATL 11.00
6 SICK 10.90
7 ERX 8.35
8 MVV 8.24
9 FAS 8.13
10 KRE 8.02
11 USD 7.87
12 URE 7.78
13 UYM 7.76
14 UYG 7.44
15 IWC 7.18
16 IJS 7.05
17 DUST 7.02
18 MWJ 6.81
19 IJR 6.72
20 TYH 6.70
21 TQQQ 6.63
22 SAA 6.48
23 XIV 6.45
24 YINN 6.40
25 IWN 6.33
Today’s Tremendously Long List of Double Digit Winners
Min mkt cap: $100 mill.
No. Ticker % Change Market Cap
1 MILL 32.42 108,010,000
2 MELA 31.10 111,910,000
3 HIL 30.63 180,150,000
4 SGK 28.19 233,120,000
5 HHGP 26.30 112,440,000
6 EPHC 24.94 296,790,000
7 SATC 24.72 113,570,000
8 FMCN 24.31 2,280,000,000
9 PNX 23.71 141,890,000
10 LXRX 23.53 310,630,000
11 WAVX 23.32 185,480,000
12 JRN 22.99 166,900,000
13 KOPN 22.65 230,650,000
14 ETM 22.32 190,860,000
15 PMFG 22.30 278,750,000
16 CVGI 21.64 182,430,000
17 STP 21.47 306,670,000
18 JKS 21.44 112,270,000
19 BLDR 21.36 120,530,000
20 SQI 20.77 267,020,000
21 AMR 20.71 992,210,000
22 WMAR 20.68 159,500,000
23 MCRI 20.35 157,830,000
24 PRO 19.55 347,180,000
25 HVT 19.41 219,270,000
26 CVO 19.34 189,700,000
27 CDZI 19.31 112,260,000
28 CSU 19.27 148,600,000
29 COHU 19.14 238,560,000
30 HDY 19.05 577,630,000
31 SRI 19.03 120,970,000
32 APOG 18.91 241,460,000
33 ATSG 18.86 247,950,000
34 CSBK 18.79 227,400,000
35 ZQK 18.70 427,160,000
36 OVTI 18.57 836,920,000
37 IBOC 18.49 887,910,000
38 SIGA 18.49 149,840,000
39 LDL 18.44 152,620,000
40 ASGN 18.37 261,850,000
41 HOME 18.27 111,390,000
42 LAD 18.04 381,290,000
43 ASIA 17.97 530,860,000
44 VRTU 17.83 309,560,000
45 DRL 17.82 138,750,000
46 FBNC 17.73 158,980,000
47 TWER 17.70 120,340,000
48 SHOR 17.66 223,680,000
49 BALT 17.65 102,900,000
50 MERU 17.61 142,610,000
No. Ticker % Change Market Cap
51 LBAI 17.52 199,390,000
52 DRRX 17.48 140,790,000
53 MOD 17.45 422,230,000
54 KMGB 17.40 135,930,000
55 WRES 17.37 150,890,000
56 TMS 17.32 285,780,000
57 NWY 17.28 194,440,000
58 OMX 17.25 417,120,000
59 RENT 17.20 129,830,000
60 RLH 17.03 122,160,000
61 AP 17.01 211,150,000
62 IRBT 16.95 675,720,000
63 MBLX 16.95 149,270,000
64 MOSY 16.92 139,330,000
65 SPAR 16.85 122,920,000
66 ALJ 16.64 342,270,000
67 WTBA 16.63 141,310,000
68 JRCC 16.58 221,040,000
69 GBX 16.56 293,090,000
70 CBM 16.41 148,330,000
71 TZOO 16.37 346,010,000
72 JMP 16.36 120,440,000
73 ZIXI 16.36 141,010,000
74 CHTP 16.32 208,420,000
75 GTAT 16.29 839,170,000
76 PROJ 16.28 366,360,000
77 CPST 16.28 259,590,000
78 DHT 16.25 131,270,000
79 NOG 16.24 1,200,000,000
80 ATMI 16.23 501,100,000
81 TISI 16.21 402,160,000
82 LTXC 16.18 238,800,000
83 CTS 16.08 279,830,000
84 KRG 16.06 232,720,000
85 URZ 15.97 105,430,000
86 CSFL 15.95 146,890,000
87 CMCO 15.91 210,140,000
88 HUSA 15.82 428,830,000
89 FRM 15.70 200,670,000
90 BUSE 15.70 376,690,000
91 OCZ 15.68 226,630,000
92 PGNX 15.63 193,480,000
93 INWK 15.60 382,070,000
94 BKYF 15.47 150,570,000
95 BKR 15.35 178,350,000
96 CIGX 15.35 272,810,000
97 HELE 15.26 776,210,000
98 STNG 15.26 158,370,000
99 AGYS 15.24 163,930,000
100 PCX 15.20 772,260,000
No. Ticker % Change Market Cap
101 HT 15.09 587,800,000
102 KELYA 15.05 419,700,000
103 INHX 15.02 192,340,000
104 GFF 14.87 517,680,000
105 PLXT 14.87 134,050,000
106 BPAX 14.85 222,210,000
107 FBN 14.81 114,340,000
108 SMP 14.79 276,980,000
109 HFWA 14.79 160,970,000
110 GFIG 14.78 487,580,000
111 CYTX 14.73 158,700,000
112 TNK 14.73 239,550,000
113 CLMS 14.66 201,460,000
114 YGE 14.63 452,420,000
115 ENTR 14.63 357,070,000
116 BGFV 14.59 131,850,000
117 TPLM 14.59 142,310,000
118 ASI 14.56 181,880,000
119 CDR 14.55 207,330,000
120 CIA 14.55 320,170,000
121 SAIA 14.53 166,120,000
122 SURW 14.50 138,930,000
123 MRGE 14.47 483,190,000
124 WIBC 14.46 177,510,000
125 FOLD 14.41 117,640,000
126 FXEN 14.40 216,660,000
127 WNC 14.32 301,480,000
128 SMBL 14.26 330,650,000
129 KAI 14.25 219,280,000
130 CAS 14.22 252,040,000
131 UBSH 14.19 264,380,000
132 GLDD 14.18 239,780,000
133 BFIN 14.13 130,890,000
134 VICR 14.13 340,320,000
135 ROCK 14.06 247,170,000
136 LUB 14.06 115,370,000
137 SSYS 14.00 380,900,000
138 BNCL 13.99 574,340,000
139 DW 13.94 441,300,000
140 CDI 13.91 204,710,000
141 ACPW 13.91 103,390,000
142 MGI 13.88 928,800,000
143 KWR 13.87 332,370,000
144 SAH 13.85 572,230,000
145 VVTV 13.81 114,380,000
146 CCNE 13.80 149,270,000
147 AFAM 13.77 155,570,000
148 MLHR 13.75 1,040,000,000
149 CFNL 13.73 249,390,000
150 FCBC 13.71 169,850,000
No. Ticker % Change Market Cap
151 PLFE 13.69 218,260,000
152 RLJ 13.67 1,250,000,000
153 HNI 13.64 856,640,000
154 CPF 13.64 430,740,000
155 IO 13.63 733,800,000
156 TESO 13.62 392,670,000
157 CHFC 13.61 420,350,000
158 ESIO 13.60 341,740,000
159 VHC 13.57 754,250,000
160 VDSI 13.56 177,150,000
161 SWS 13.51 137,310,000
162 OYOG 13.47 333,110,000
163 LZB 13.46 385,740,000
164 IFSIA 13.45 776,530,000
165 TSL 13.44 392,370,000
166 ABG 13.34 533,010,000
167 MEI 13.31 275,060,000
168 CWCO 13.27 114,740,000
169 PNFP 13.23 366,000,000
170 CGX 13.21 400,000,000
171 SHEN 13.19 248,750,000
172 CENT 13.15 368,770,000
173 CIR 13.13 506,690,000
174 ELY 13.11 334,100,000
175 ALGN 13.11 1,190,000,000
176 CBOU 13.08 245,130,000
177 SCBT 13.07 332,770,000
178 UEIC 13.07 235,720,000
179 NCS 13.06 150,440,000
180 EBF 13.06 340,270,000
181 NATR 13.04 194,490,000
182 KSWS 13.03 151,130,000
183 USU 13.01 150,030,000
184 KNL 13.00 633,670,000
185 FUR 12.99 268,940,000
186 ININ 12.98 509,700,000
187 PRSC 12.97 138,380,000
188 HSII 12.95 293,450,000
189 VSEC 12.90 131,970,000
190 FMBI 12.88 545,160,000
191 RSYS 12.87 171,510,000
192 TCBK 12.87 196,050,000
193 COR 12.85 252,890,000
194 KFY 12.85 581,710,000
195 SBX 12.83 145,360,000
196 LIOX 12.83 142,220,000
197 CBEY 12.81 216,830,000
198 BOOM 12.80 210,310,000
199 CBK 12.80 126,380,000
200 MPG 12.77 104,570,000
No. Ticker % Change Market Cap
201 SWHC 12.77 151,840,000
202 HNR 12.77 292,450,000
203 XIDE 12.77 293,630,000
204 PAG 12.75 1,470,000,000
205 GLCH 12.73 136,470,000
206 PCRX 12.73 151,650,000
207 XRM 12.71 146,510,000
208 PBY 12.67 519,890,000
209 SXI 12.64 370,730,000
210 CBR 12.59 218,280,000
211 JASO 12.58 292,730,000
212 MCS 12.57 295,210,000
213 ABD 12.56 263,210,000
214 PKY 12.56 243,410,000
215 GST 12.55 189,400,000
216 UFCS 12.52 423,660,000
217 FTK 12.50 232,420,000
218 MG 12.50 485,900,000
219 ZEP 12.49 312,860,000
220 HTLF 12.49 210,620,000
221 IN 12.48 388,540,000
222 PSEM 12.45 181,350,000
223 STMP 12.45 276,620,000
224 MOV 12.44 302,890,000
225 ANAD 12.44 146,480,000
226 FIX 12.44 314,300,000
227 PKE 12.41 443,210,000
228 PGI 12.41 328,910,000
229 NGS 12.37 156,860,000
230 CLFC 12.33 187,220,000
231 PKT 12.32 122,240,000
232 ISSI 12.32 210,060,000
233 AEGR 12.30 254,240,000
234 SCS 12.30 803,720,000
235 TMP 12.30 365,550,000
236 FSS 12.29 274,850,000
237 MLNK 12.28 151,180,000
238 FBC 12.22 271,550,000
239 ARII 12.19 328,390,000
240 QLTY 12.17 208,580,000
241 EXL 12.17 277,460,000
242 HOTT 12.16 342,690,000
243 EPL 12.15 445,410,000
244 SPRD 12.15 841,290,000
245 XRTX 12.10 266,770,000
246 RST 12.10 186,510,000
247 VVI 12.09 328,620,000
248 ACCL 12.09 334,910,000
249 EXEL 12.07 704,200,000
250 ZINC 12.06 282,710,000
No. Ticker % Change Market Cap
251 TLB 12.05 176,070,000
252 LABL 12.02 285,390,000
253 AHS 12.02 161,930,000
254 IPAR 12.01 471,830,000
255 RTK 11.99 167,530,000
256 NAK 11.97 509,060,000
257 SIMO 11.96 330,350,000
258 RPTP 11.96 153,260,000
259 LMIA 11.94 197,160,000
260 STEL 11.93 215,950,000
261 URI 11.89 993,410,000
262 SHFL 11.89 415,130,000
263 DLX 11.86 949,210,000
264 AVNW 11.84 137,240,000
265 PERY 11.83 287,410,000
266 FFIC 11.83 332,880,000
267 OME 11.82 175,920,000
268 SHLD 11.79 6,120,000,000
269 KLIC 11.79 542,330,000
270 DK 11.74 653,480,000
271 ISLE 11.73 187,450,000
272 NCT 11.73 297,380,000
273 PEBO 11.70 105,950,000
274 LXU 11.69 638,020,000
275 BPFH 11.68 458,820,000
276 CMRG 11.67 170,910,000
277 SMCI 11.65 457,920,000
278 SASR 11.64 352,540,000
279 AMWD 11.64 173,340,000
280 DNDN 11.63 1,340,000,000
281 CONN 11.63 228,880,000
282 ACTV 11.60 770,650,000
283 BANF 11.57 505,890,000
284 SHOO 11.57 1,210,000,000
285 CHRS 11.57 302,830,000
286 OPWV 11.56 133,290,000
287 ARCL 11.54 204,770,000
288 NEWS 11.53 468,760,000
289 BWS 11.53 298,830,000
290 SSD 11.53 1,160,000,000
291 FSR 11.50 545,440,000
292 NP 11.50 212,540,000
293 ETH 11.50 391,860,000
294 KCP 11.47 195,690,000
295 BRKS 11.44 526,490,000
296 DAL 11.43 6,350,000,000
297 ASTE 11.41 664,220,000
298 CYNO 11.41 127,260,000
299 AF 11.39 715,420,000
300 OCFC 11.38 207,620,000
No. Ticker % Change Market Cap
301 RNST 11.36 319,030,000
302 NARA 11.36 231,250,000
303 MEA 11.35 185,060,000
304 NX 11.32 405,430,000
305 CATY 11.32 894,900,000
306 GRC 11.31 518,170,000
307 GTY 11.31 481,540,000
308 CWTR 11.30 115,860,000
309 WBS 11.30 1,280,000,000
310 ARRY 11.30 111,190,000
311 RNET 11.29 224,220,000
312 LCRY 11.29 112,580,000
313 EXAM 11.28 292,070,000
314 IPCC 11.28 641,460,000
315 FST 11.25 1,610,000,000
316 SMA 11.25 264,790,000
317 HURC 11.23 129,960,000
318 FOR 11.22 382,450,000
319 SFNC 11.21 355,980,000
320 BHE 11.21 775,300,000
321 CPLA 11.20 431,520,000
322 DM 11.18 270,990,000
323 INDB 11.17 466,630,000
324 BPOP 11.16 1,540,000,000
325 RECN 11.16 445,240,000
326 TBBK 11.15 217,430,000
327 FPO 11.15 624,210,000
328 CX 11.15 3,290,000,000
329 MTW 11.15 885,060,000
330 BGG 11.14 683,440,000
331 AYI 11.13 1,530,000,000
332 ICFI 11.13 371,690,000
333 ZAGG 11.13 274,550,000
334 PVTB 11.13 539,970,000
335 SSI 11.12 408,490,000
336 QTM 11.11 419,740,000
337 TCBI 11.09 817,900,000
338 GPK 11.08 1,340,000,000
339 BXS 11.03 733,020,000
340 FARO 11.02 524,230,000
341 ROLL 11.01 745,600,000
342 AAON 10.97 388,410,000
343 DDD 10.96 705,710,000
344 PJC 10.95 284,480,000
345 DY 10.93 512,410,000
346 MRCY 10.93 348,780,000
347 FIBK 10.93 424,480,000
348 TWI 10.92 582,490,000
349 HEES 10.88 286,990,000
350 QRE 10.88 656,740,000
No. Ticker % Change Market Cap
351 OSIS 10.86 657,030,000
352 GEOI 10.86 453,130,000
353 TRMK 10.85 1,100,000,000
354 HWKN 10.82 307,460,000
355 AMCC 10.81 345,680,000
356 AIR 10.81 647,810,000
357 HF 10.81 306,000,000
358 VIVO 10.81 611,660,000
359 ARX 10.80 771,580,000
360 COLB 10.78 565,580,000
361 MSFG 10.78 176,100,000
362 BBOX 10.76 385,180,000
363 MDCA 10.76 404,900,000
364 GLF 10.74 953,740,000
365 JOUT 10.74 150,400,000
366 SYUT 10.74 272,180,000
367 CYMI 10.73 1,130,000,000
368 CRIS 10.73 241,880,000
369 FORM 10.72 316,790,000
370 RBN 10.71 1,590,000,000
371 PLXS 10.71 801,470,000
372 WMS 10.71 921,200,000
373 ABMD 10.70 415,520,000
374 HSOL 10.70 202,220,000
375 SURG 10.69 130,820,000
376 HPP 10.69 364,260,000
377 WNR 10.68 1,050,000,000
378 DATE 10.68 178,750,000
379 MS 10.67 26,050,000,000
380 CLF 10.66 7,470,000,000
381 CHOP 10.64 137,820,000
382 SEAC 10.63 236,360,000
383 EBIX 10.62 507,520,000
384 AFCE 10.59 288,470,000
385 GBCI 10.56 673,840,000
386 WASH 10.55 304,090,000
387 HAYN 10.55 524,790,000
388 TGH 10.54 965,700,000
389 CAB 10.53 1,420,000,000
390 RMBS 10.52 1,530,000,000
391 ACO 10.52 759,210,000
392 UBNK 10.51 203,010,000
393 UFPI 10.51 451,610,000
394 SUP 10.51 400,540,000
395 CAP 10.51 226,140,000
396 STL 10.49 206,260,000
397 PCBK 10.47 121,470,000
398 ENTG 10.47 861,300,000
399 ARIA 10.46 1,170,000,000
400 ARO 10.45 872,760,000
No. Ticker % Change Market Cap
401 NFP 10.44 468,190,000
402 ENV 10.42 304,730,000
403 FFIN 10.41 822,760,000
404 ABCB 10.41 207,000,000
405 LNDC 10.40 140,470,000
406 SNHY 10.40 498,400,000
407 PRTS 10.39 142,710,000
408 VNDA 10.37 135,460,000
409 PLCM 10.35 3,250,000,000
410 AVL 10.33 227,730,000
411 WAL 10.31 415,670,000
412 UTEK 10.30 413,690,000
413 AKAM 10.29 3,670,000,000
414 LSE 10.28 245,680,000
415 MSA 10.27 987,440,000
416 MCHX 10.26 284,940,000
417 UEC 10.25 173,420,000
418 AEIS 10.24 376,110,000
419 TMH 10.23 1,070,000,000
420 PRGS 10.23 1,170,000,000
421 FFIV 10.22 5,740,000,000
422 BID 10.22 1,860,000,000
423 WIRE 10.22 471,660,000
424 IIIN 10.21 177,380,000
425 FTEK 10.19 141,620,000
426 CPWM 10.18 140,620,000
427 SBNY 10.17 2,200,000,000
428 CODI 10.17 569,100,000
429 BMTC 10.15 214,560,000
430 TITN 10.15 319,120,000
431 ARB 10.15 900,370,000
432 WWWW 10.12 182,690,000
433 EXAR 10.11 255,510,000
434 FMER 10.08 1,240,000,000
435 MSCC 10.07 1,390,000,000
436 ASCA 10.07 523,890,000
437 GCO 10.06 1,250,000,000
438 ONB 10.06 883,080,000
439 CUB 10.06 1,040,000,000
440 OUTD 10.04 142,220,000
441 AUDC 10.04 129,820,000
442 SMSC 10.04 425,090,000
443 HLIT 10.03 492,890,000
444 FFG 10.03 777,930,000
445 RGR 10.03 491,260,000
446 CCBG 10.02 172,880,000
447 MPW 10.01 999,770,000
FLASH: Moody’s Downgrades Italy, Outlook Negative
Via Moody’s
Prime-1 ratings affirmed
Frankfurt am Main, October 04, 2011 — Moody’s Investors Service has today downgraded Italy’s government bond ratings to A2 with a negative outlook from Aa2, while affirming its short-term ratings at Prime-1. The rating action concludes the review for downgrade initiated by Moody’s on 17 June, 2011.
The main drivers that prompted the rating downgrade are:
(1) The material increase in long-term funding risks for euro area sovereigns with high levels of public debt, such as Italy, as a result of the sustained and non-cyclical erosion of confidence in the wholesale finance environment for euro sovereigns, due to the current sovereign debt crisis.
(2) The increased downside risks to economic growth due to macroeconomic structural weaknesses and a weakening global outlook.
(3) The implementation risks and time needed to achieve the government’s fiscal consolidation targets to reverse the adverse trend observed in the public debt, due to economic and political uncertainties.
The downgrade reflects the weight of these growing risks relative to some positive credit attributes. These include a lack of significant imbalances in the economy or severe pressure on private financial and non-financial sector balance sheets, as well as the actions undertaken by the government over the summer. Moody’s notes that the size of the rating action is largely driven by the sustained increase in the country’s susceptibility to financial shocks due to a structural shift in market sentiment regarding euro-area countries with high debt burdens. A country’s susceptibility to shocks is a key factor under Moody’s sovereign methodology.
The negative outlook reflects ongoing economic and financial risks in Italy and in the euro area. The uncertain market environment and the risk of further deterioration in investor sentiment could constrain the country’s access to the public debt markets. If such risks were to materialise and the long-term availability of external sources of liquidity support were to remain uncertain, the country’s rating could transition to substantially lower rating levels.
RATIONALE FOR DOWNGRADE
The downgrade stems from three closely related drivers:
1) The fragile market sentiment that continues to surround euro area sovereigns with high levels of debt implies materially increased financing costs and funding risks for Italy. The country is a frequent issuer with refinancing needs of more than EUR200 billion in 2012. Although future policy actions within the euro area could reduce investors’ concerns and stabilise funding markets, the opposite is also increasingly possible. Even if policy actions were to succeed in the short term in returning some degree of normality to euro area sovereign debt markets, the underlying fragility and loss of confidence is deep and likely to be sustained. As indicated by the A2 rating, the risk of default by Italy remains remote. Nonetheless, Moody’s believes that the structural shift in sentiment in the euro area funding market implies increased vulnerability of this country to loss of market access at affordable rates that is incompatible with a ‘Aa’ rating. Moreover, the preponderance of downside risks and the potential for rapid rating transition which those risks imply are not compatible with a rating at the top end of the ‘A’ range. The repositioning of Italy’s government bond rating to A2 reflects Moody’s judgment of the balance of long-term risks facing the Italian sovereign. It is consistent with Moody’s broader reassessment of sovereign risk in the euro area, focusing on member countries that are more susceptible to confidence-related shocks due to high public debt exposure and/or large fiscal imbalances.
2) The Italian economy continues to face significant challenges due to structural economic weaknesses. These problems — mainly low productivity and important labour and product market rigidities — have been an impediment to the achievement of higher potential growth rates over the past decade and continue to hinder the economy’s recovery from the severe recession it experienced in 2009. These structural impediments to economic growth cannot be removed quickly. The government’s reform plans have only just started to address some of these structural challenges, and they need to be implemented efficiently. Moreover, moderate medium-term growth prospects for the Italian economy have been further revised downwards due to potential adverse effects of a weakening European and global growth outlook. Economic growth will be a crucial factor determining the government’s revenues, the achievement of fiscal consolidation targets and, ultimately, its debt trajectory.
3) Finally, there is increasing uncertainty for the government to achieve fiscal consolidation targets. Since more than half of the consolidation measures are based on government revenue growth, the plans are vulnerable to the high level of uncertainty around economic growth in Italy and elsewhere in the EU. Moreover, political consensus on additional expenditure cuts can be difficult to achieve. As a consequence, the government may find it challenging to generate the primary surpluses that are needed to place the public debt-to-GDP ratio and the interest burden on a solid downward trend. Moody’s expects Italy’s public debt-to-GDP ratio to reach 120% at the end of this year, up from 104% at the start of the global crisis. As well as posing a risk to Italy’s financial strength, which is a key consideration under Moody’s sovereign methodology, failure to achieve fiscal and debt targets could increase the country’s susceptibility to financial market shocks.
PRINCIPAL METHODOLOGY
The principal methodology used in this rating was Sovereign Bond Ratings published in September 2008. Please see the Credit Policy page on www.moodys.com for a copy of this methodology.
REGULATORY DISCLOSURES
For ratings issued on a program, series or category/class of debt, this announcement provides relevant regulatory disclosures in relation to each rating of a subsequently issued bond or note of the same series or category/class of debt or pursuant to a program for which the ratings are derived exclusively from existing ratings in accordance with Moody’s rating practices. For ratings issued on a support provider, this announcement provides relevant regulatory disclosures in relation to the rating action on the support provider and in relation to each particular rating action for securities that derive their credit ratings from the support provider’s credit rating. For provisional ratings, this announcement provides relevant regulatory disclosures in relation to the provisional rating assigned, and in relation to a definitive rating that may be assigned subsequent to the final issuance of the debt, in each case where the transaction structure and terms have not changed prior to the assignment of the definitive rating in a manner that would have affected the rating. For further information please see the ratings tab on the issuer/entity page for the respective issuer on www.moodys.com.
This rating was initiated by Moody’s and was not requested by the rated entity.
This rated entity or its agent(s) participated in the rating process. The rated entity or its agent(s) provided Moody’s access to the books, records and other relevant internal documents of the rated entity.
The rating has been disclosed to the rated entity or its designated agent(s) and issued with no amendment resulting from that disclosure.
Information sources used to prepare the rating are the following : parties involved in the ratings, parties not involved in the ratings and public information.
Moody’s considers the quality of information available on the rated entity, obligation or credit satisfactory for the purposes of issuing a rating.
Moody’s adopts all necessary measures so that the information it uses in assigning a rating is of sufficient quality and from sources Moody’s considers to be reliable including, when appropriate, independent third-party sources. However, Moody’s is not an auditor and cannot in every instance independently verify or validate information received in the rating process.
Moody’s Investors Service may have provided Ancillary or Other Permissible Service(s) to the rated entity or its related third parties within the three years preceding the credit rating action. Please see the special report “Ancillary or other permissible services provided to entities rated by MIS’s EU credit rating agencies” on the ratings disclosure page on our website www.moodys.com for further information.
Please see Moody’s Rating Symbols and Definitions on the Rating Process page on www.moodys.com for further information on the meaning of each rating category and the definition of default and recovery.
Please see ratings tab on the issuer/entity page on www.moodys.com for the last rating action and the rating history.
The date on which some ratings were first released goes back to a time before Moody’s ratings were fully digitized and accurate data may not be available. Consequently, Moody’s provides a date that it believes is the most reliable and accurate based on the information that is available to it. Please see the ratings disclosure page on our website www.moodys.com for further information.
Please see www.moodys.com for any updates on changes to the lead rating analyst and to the Moody’s legal entity that has issued the rating.
Alexander Kockerbeck
VP – Senior Credit Officer
Sovereign Risk Group
Moody’s Deutschland GmbH
An der Welle 5
Frankfurt am Main 60322
Germany
JOURNALISTS: 44 20 7772 5456
SUBSCRIBERS: 44 20 7772 5454
Bart Oosterveld
MD – Sovereign Risk
Sovereign Risk Group
JOURNALISTS: 212-553-0376
SUBSCRIBERS: 212-553-1653
Releasing Office:
Moody’s Deutschland GmbH
An der Welle 5
Frankfurt am Main 60322
Germany
JOURNALISTS: 44 20 7772 5456
SUBSCRIBERS: 44 20 7772 5454
FLASH: Dexia to be Bailed Out
Belgium Confirms Creation Of A ‘Bad Bank’ For Risky Assets
Comments »FLASH: Acme Packet Destroyed on EPS Warning
-30%
Co issues downside Q3 guidance and Co also reaffirmed 2011 EPS of $1.14-1.18 vs. $1.13 Capital IQ Consensus Estimate; reaffirms revs of $315-320 mln vs. $325.2 mln consensus. Co said, “While we remain confident in our second half growth plans, our Q3 results were adversely impacted by a very large opportunity at one of the two largest service providers in North America. We now expect this opportunity to close in the first half of Q4 and we remain confident in our ability to execute on our full year business outlook. I continue to believe we are well positioned to leverage the broad, multi-year, secular growth drivers associated with the global transition from TDM to IP for real time communications like voice and video. The co was recently selected as the session border controller supplier for a major universal voice platform at this Tier-1 service provider in the United States. This platform is initially designed to support the existing customer’s “over-the-top” and wireline service offerings and will become a key infrastructure component to their Voice over Long Term Evolution offering. This platform is expected to become one of the largest such deployments in North America, supporting over 100 million subscribers. The initial deployment, which the co estimates will support ~5 mln subscribers, was expected to close in Q3 of 2011. However, during the final stage of Q3, the orders associated with this initial deployment were delayed to Q4. Accordingly, the co now expects this opportunity to close in the first half of Q4 of 2011.
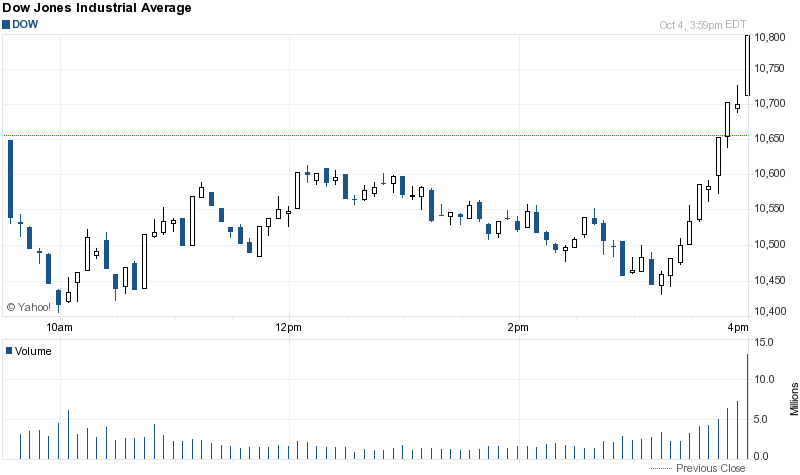
Comments »FLASH: The Market Stages an Incredible Late Day Rally
So You Want Little Government; Be Careful What You Kill
Not that i’m for big government or a fan of the FDA, but if you want to dismantle it and make it smaller please remember to beef up important aspects for citizen protection….
Comments »