Yours truly. 😉
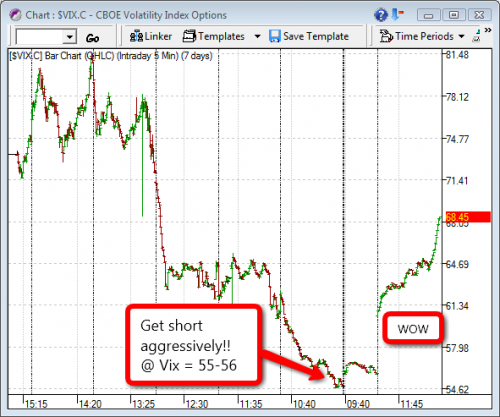
I used to hang out over at WallStreak, now I post my intraday moves on Twitter through StockTwits. Whenever I see a good setup for trading, I usually take the top spot on the “top talkers” list… I think out loud a lot! Hope yall caught some good shorts today! We started off shorting at the open, and never looked back. Top picks were to short $SPWRA and long $SKF. I really warned you about these Sisyphean Type rallies last week… they ALWAYS end in the boulder coming smashing down! And once again, I used the Vix to pinpoint an almost exact area for shorting aggressively…
“The Vix is near the mid-50s, which I targeted as a point to short the market as traders become blinded by complacency.” –http://ibankcoin.com/gioblog/?p=2397
Always pay attention to a rally if it is legit or not! Stocks moving up + Volume moving down + Vix moving down = horrible rally.
More importantly, it was critical that you cover as many short positions as you could into this sell-off. The Vix spiked an incredible 23% today, so do not overlook that. This is only the first “spike”, so you can take a chance, but when the market drops -670 points, please don’t be greedy, take a profit while you can, it is like once in every 20 years you get a day like this.
Today’s tape deserves this video again..
Check out the rest of iBankCoin’s posse over at StockTwits:


You caught that SKF wave this time, hmmm? Good work!
The U.S. stock market is no longer quite panicking as if its hair were on fire. For stock investors, that is a bit of a relief, but not much.
The most popular proxy for market fear is the Chicago Board Options Exchange’s Volatility Index, or VIX. It peaked at nearly 81 about two weeks ago, roughly four times its historical average of about 20. Crescendos of fear sometimes mark stock-market bottoms, and on cue, the VIX has fallen sharply since then, and stocks have rallied.
Last week, in a move that pleased technical analysts, the VIX fell below its 50-day moving average for the first time since markets hit full panic mode in mid-September.
Still, the VIX’s closing price Friday of 55.84 was unprecedented before October. Its 50-day moving average, which indicates the trend, is still moving higher; values for days now falling out of the sample were in the 30s. The VIX has exceeded 30, an unusually high level, for the past 54 trading days.
To find volatility so high for so long, one has to look long before the VIX’s invention in 1993 by Robert Whaley, now a finance professor at Vanderbilt University.
Christopher Finger, European head of research at RiskMetrics Group, has a model that crunches returns on the Dow Jones Industrial Average into something approaching a VIX going back to 1900. According to his estimates, volatility has hit higher peaks twice since 1900, at the crashes of 1987 and 1929. But in terms of persistently high volatility, only the 1930s were worse than today. Other analysts’ models back him up or suggest the current sustained volatility is actually the worst in history.
Volatility may not return to its highs, but it isn’t clear when it will get back to normal, either. Volatility breeds fear, which breeds more volatility. There is still too much uncertainty about the losses lurking on bank balance sheets and about the depth and breadth of the current recession to inspire much calm.
The VIX could stay above 40 for much of the next year, estimates Bespoke Investment Group co-founder Justin Walters. He suggests new leveraged exchange-traded funds, off-exchange trading vehicles and other market advancements are adding to the churn.
This is troubling for stock investors. Long stretches of volatility typically bring ugly stock returns.
In the 1930s, the Dow and the S&P each suffered six bear markets; no decade before or since has been as brutal. In the worst of those bear markets, from 1930-32, both indexes lost more than 80%.
Then again, there were also six rip-snorting bull markets in the 1930s. In each of them, the Dow and S&P 500 gained, on average, about 80%.
Though nothing yet suggests the coming period will be as dramatic as the 1930s, a very rough ride might still be in store.
“Somebody who could time the market perfectly is in for a good time,” Mr. Finger said. “I don’t know any of those people.”
scum… SKF did little for me actually, but it was a swing trade.
Most of the gains came from fading SPWRA, FSLR, and MELI as a swing trade, and adding to the day trades. I think the market was doomed today when the commodities, the last hold for the bulls, fell apart. Was watching em all morning show strength, then give up around noon.
I now only am shorting bank stocks.
Hey Joe, thanks for that tip on the Vix. However, I’m not sure how effective it would be to measure the Vix over that long of a period. Right now, I’m using relative channels on the Vix, since market fear is something that takes a while to fully rid of… there’s always some kind of cushion on the Vix, and calculating that cannot be done with numbers that easily.
What a difference a day makes. Two XOM charts I looked at look totally different since Friday’s shenanigans. Both went from breakout to wider bearish downtrend channel again.
chart 1
chart 2
Please don’t go all woodshedder shnobbity shnobbity on me about the charts.