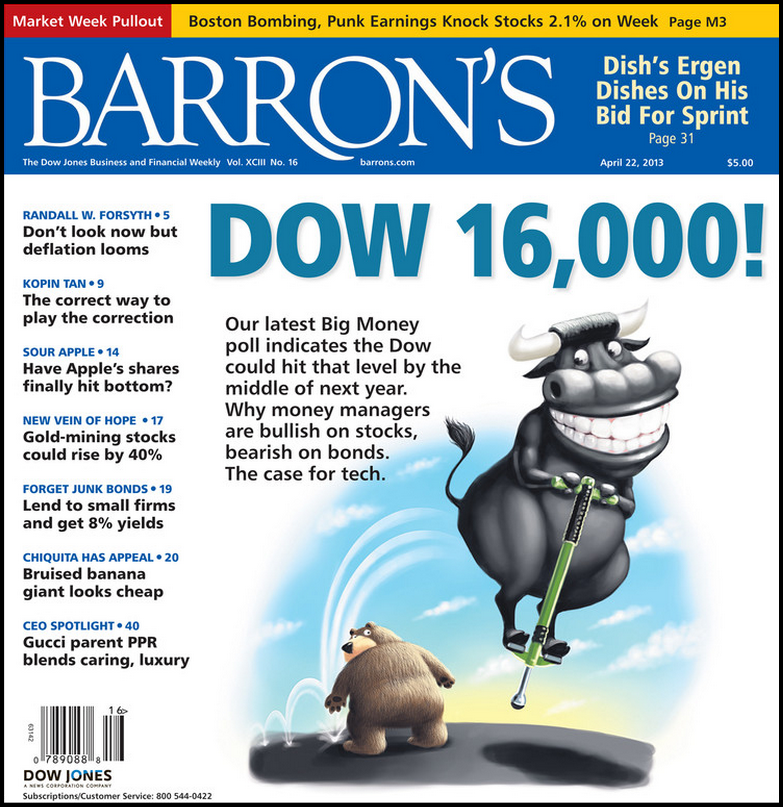
The above cover of Barron’s over the weekend is obviously in stark contrast to the infamous AAII sentiment survey not long ago, with bearish sentiment off the charts. Obviously, the top-shelf artwork above indicates that the “big money” poll is wildly bullish.
The fact of the matter is that sentiment is highly subjective and can turn on a dime, which means we need to be all the more in tune with what the stock market is actually doing.
With this in mind, here is an excerpt from my Weekly Strategy Session, which I published and sent out to members earlier today. Keep in mind, it is just a very small portion of the full Strategy Session.
To read the full version, please click here for details.
________________________________
First, the weekly chart of the S&P, below, lends itself to three main points to consider:
1) The S&P 500 weekly chart shows that price continues to hold the 10-week moving average (light blue line). As we have discussed in 2013, the 10-week moving average on a major index or sector is often valuable to observe because it is highly under-watched by many traders, and is particularly valuable when price shows it is reacting and sensitive to it. In the late-February/early-March correction this year, when many market players were calling for a major top (recall the ubiquitous calls for a bearish “megaphone” top on the Dow, a thesis we viewed with a skeptical eye in these Strategy Sessions), we instead focused on the Russell 2000 Index and the financials, two market leaders, holding their respective 10-week moving averages as helping the bull case for a mild, contained pullback in lieu of a major top.
Here, even though price continues to hold the 10-week moving average (which is currently at 1548 and rising), you can see that price is “churning” just above it–Churning in the sense that we have been seeing heavy sell volume since late-March with low buy volume (see the bottom of the chart below as evidence), while price is not making much progress to the upside. Churning often indicates that buyers are losing their grip on the uptrend. And it is usually a sign for swing traders to become defensive and exude patience until the indecision is resolved.
2) On a deeper price pullback, the bull need not perish. Instead, continue to watch the major support trendline which I have drawn below (purple line), dating back to the November 2012 correction lows. That trendline currently sits just above 1500. Should price come plunging down to it, it is likely market sentiment will have become wildly bearish, and thus conditions ripe to consider looking for bullish divergences to play for a correction low.
3) Another reason to not fully load up your portfolio with bearish directional bets here and instead opt for largely a cash position is that all weekly chart moving averages continue to be lined up properly (20, then 50, etc.) and clearly rising. Uptrends are uniquely difficult in which to declare a major inflection point. But we can still use extreme caution when the inevitable correction or periods of slowing momentum occur.


Excellent analysis… Thanks for sharing.
Thank you, Richard. My pleasure.
Conflicting data, and I can make it worse…the yen has a very high negative correlation to US stocks, kamakazi QE should provide another source of demand for our already crowded and overbought markets. Despite the fact that it seems like US stocks ought to pull back they just can’t seem to do it. The market appears that it is building a top so I have some cash, luckily, there are both longs and shorts working so it is possible to engineer in some safety. Gotta be ready for anything in this market- no problem, trading is what we do, no? BTW thanks for your thoughts, always a good read.
Thanks, Mike!
The AAII survey has been leaning more bearish than the Investor Intelligence survey for some time. In fact, the last time the AAII survey was more bullish than its counterpart was in 02/12 (looking at the 4 week average of the bull:bear ratio). So gauging sentiment appears difficult – at least to me. Perhaps the Barrons Cover is the real deal though!
Thanks Chess 😉