Josh Brown had an interesting post up yesterday, presenting a visual from The Charts Etc blog.
The Charts Etc blog has a trio of charts indicating the arrival of a risk-off atmosphere after an extremely long, virtually uninterrupted, bull run.
This one is interesting, you’re seeing the S&P 500 vs junk bonds priced in Treasurys:
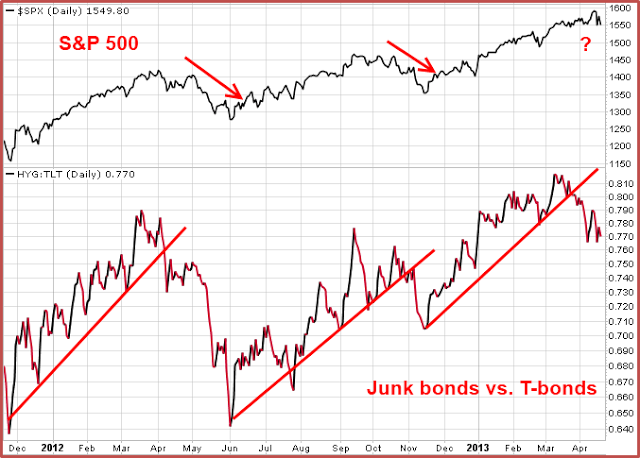
As you can see, if history is any guide then equities are facing headwinds regarding an imminent, sustained leg higher from here, even if a deeper correction does not materialize.
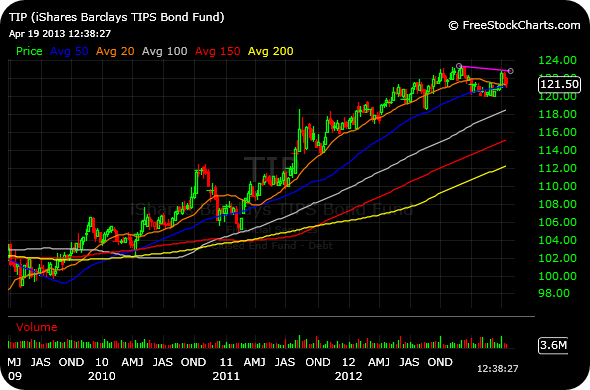
Also consider TIPs, which I referenced the past few years. They appear to have made a lower high, but certainly have not rolled over yet. I am watching the, though, as any big moves here would be noteworthy.
_______________________________


treasury 5yr fwd breakeven is one of the favored infltion metrics used by the Fed… had its first trend break back on 1/25
nice!