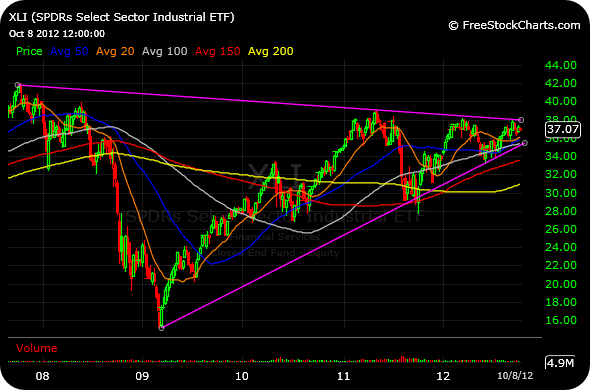
The XLI ticker symbol does not get much press, but that sector ETF for the industrials is sporting an intriguing, multi-year symmetrical triangle near resolution. Note the significance of breaking through the $38 level, on the weekly timeframe above. Led by General Electric and quite a few transports attempting to carve out an important low, the once-dead money industrials might have one final dance before the cyclical bull since March 2009 comes to a close.
Components and weightings as of 10/5/12. for XLI, courtesy of Select SPDR’s.
| Name | Symbol | Index Weight | |
| 1 | General Electric Co. | GE | 13.66% |
| 2 | United Technologies Corp. | UTX | 5.17% |
| 3 | Union Pacific Corp. | UNP | 4.76% |
| 4 | 3M Co. | MMM | 4.68% |
| 5 | Caterpillar Inc. | CAT | 4.50% |
| 6 | United Parcel Service Inc. Cl B | UPS | 4.04% |
| 7 | Honeywell International Inc. | HON | 3.82% |
| 8 | Boeing Co. | BA | 3.79% |
| 9 | Emerson Electric Co. | EMR | 2.86% |
| 10 | Danaher Corp. | DHR | 2.80% |
| 11 | Deere & Co. | DE | 2.74% |
| 12 | Cummins Inc. | CMI | 2.27% |
| 13 | Illinois Tool Works Inc. | ITW | 2.10% |
| 14 | FedEx Corp. | FDX | 2.05% |
| 15 | CSX Corp. | CSX | 2.03% |


Thanks for the chart. With the election and fiscal cliff coming up, I would be really surprised if this broke upward anytime before next March. But let’s see…