_____________________________________
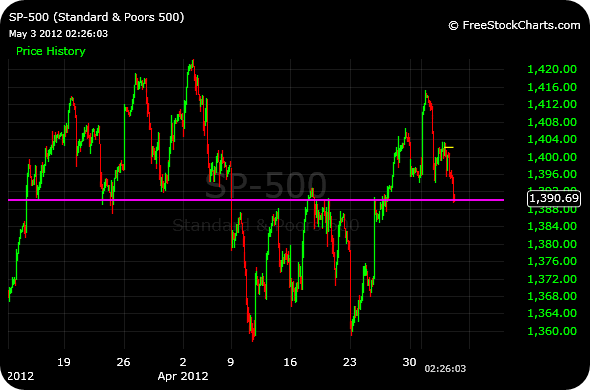
Keeping it simple, there really is no other bare bones chart that best describes the current market than the zoomed-out 30-munute chart of the S&P 500 index below. As you can see, there are no moving averages, nor any other indictor (including volume). Price has responded–and been extraordinarily sensitive to–the low-1390’s for over two months now. I had been wading back into the market over the past week, still with a 60% cash position. If the bears can make progress and breach this level, I am going to respect a close and hold below 1390 by becoming even more defensive. At the same time, I am not assuming the a breakdown will happen. In short, I am a keen spectator here, not looking to force any trades this afternoon.
_____________________________________