iBankCoin
Joined Nov 11, 2007
1,458 Blog Posts

High Tight Flags for Friday

This weekend I will be publishing a review of all of the High Tight Flags identified over the last 30 days. Stocks get dropped from the screen for a variety of reasons, but most likely because they have started making new highs or lower lows. The review should be instructive and valuable. In the mean time, here are the HTFs that made the cut Thursday after the close.

Comments »

Looking For a Quick Bounce

A quick glance tonight at the charts leads me to believe there is more downside, but one of my favorite indicators is signaling a quick bounce may be had.

Click on the chart to enlarge.

The above indicator is based upon the number of declining stocks. It is bounded, meaning that it measures the current number of decliners against previous numbers of decliners and ranks the current reading from 0 to 100. Tonight’s reading of 93.25 is high.

Using SPY, if we buy the next open after a reading of 90, and sell at the close when the close is higher than the previous close, the indicator has been correct 64.19% of the time. Each trade lasts about 2 days. The sample size is 472 trades. The green arrows in the chart above shows the buys while the red arrows show the sells.

The setup does not typically generate large percentage gains, but as a mechanism for timing the market, it does have an edge. Therefore a quick bounce tomorrow or even Friday should not be surprising.

Comments »

The Daily Dip Subscriber Email

Every evening PDS subscribers receive an email, “The Daily Dip” which details the stocks sold that day, lists the open positions to be closed the next day, and lists any new positions for the next open.

Last night’s email was particularly nice since the system closed many winning trades and is scheduled to closed more today. The text of the email is below.

————————————————————————————————

Here’s a quick summary of today’s action:

The following positions were sold today at the closing bell:
Sold AHT for a 9.48% gain.
Sold CE for a 9.48% gain.
Sold NUAN for a 7.94% gain.
Sold NUAN for a 7.56% gain.
Sold CYOU for a 7.03% gain.
Sold MICC for a 5.36% gain.
Sold OMEX for a 4.84% gain.
Sold AIT for a 4.65% gain.
Sold UTIW for a 4.60% gain.
Sold IR for a 4.31% gain.
Sold IEX for a 3.13% gain.
Sold IJK for a 3.06% gain.
Sold IWP for a 3.05% gain.
Sold RGLD for a 3.02% gain.
Sold AIT for a 3.01% gain.
Sold EBAY for a 2.82% gain.
Sold STX for a 2.72% gain.
Sold BAS for a 2.69% gain.
Sold APD for a 2.30% gain.
Sold IWS for a 2.27% gain.
Sold FLIR for a 2.13% gain.
Sold DVY for a 1.61% gain.
Sold AWP for a 1.53% gain.
Sold TQQQ for a 1.49% gain.
Sold PNR for a 1.39% gain.
Sold IRWD for a 1.36% gain.
Sold IWP for a 1.33% gain.
Sold ECL for a 1.25% gain.
Sold WAT for a 1.21% gain.
Sold TYH for a 1.16% gain.
Sold QLD for a 1.06% gain.
Sold EROC for a 1.04% gain.
Sold RSP for a 1.01% gain.
Sold FAST for a 0.99% gain.
Sold VUG for a 0.90% gain.
Sold SDY for a 0.78% gain.
Sold IWF for a 0.76% gain.
Sold IVW for a 0.70% gain.
Sold STX for a 0.68% gain.
Sold XLK for a 0.64% gain.
Sold STX for a 0.51% gain.
Sold XLI for a 0.42% gain.
Sold BAS for a 0.11% gain.
Sold EROC for a -3.78% loss.
Sold MILL for a -6.32% loss.

The following positions closed above their exit thresholds today, and are scheduled to be sold at the next closing bell:
SLH
DRN
ROIAK
EQY
WWD
BMR
NWS
YSI
URE
TKR
WTI
MAC
AIV
NGG
WWD
GGP
CUZ
FMBI
VNO
CAR
DEI
ALV
EQR
PENN
UPRO
RWR
ICF
VNQ
WTI
SIAL
IYR
EWG
HIW
BBBY
TDC
COF
GWW
PENN
CMCSK
PSO
CMCSA
SSO
XHB
HIW
CLI
CA
DDM
EMC
EWD
SI
SCHB
GRM
IWB
DHR
MYL
SPY
IVV
DIA
VTV
SLGN
AME
WM
DEI
DRH
PENN
HRL
COF
RWX
SNA
EWG
GME

No new picks were generated tonight.

-The Power Dip Team

Comments »

Power Dip System Visits The Doctor

PDS has been suffering a drawdown recently. And while the drawdown appears to be fairly normal, it is always healthy to take a look under the system’s hood, to be sure that everything is okay. Much like a doctor giving a patient an EKG, I have processed crucial data to determine whether or not everything is running within normal parameters. Based on the control charts below, the system appears to be experiencing a normal cycle of under-performance, and does not appear to be developing any abnormal traits.

20 Trade Moving Average of each Trade’s Profit/Loss

I know, it sounds complicated. It is not. Here is how it is figured.

  1. Get the % profit/loss of each trade.
  2. Average the % profit/loss of the first 20 trades.
  3. Create a moving average where the 1st trade is dropped from the average and trade 21 is added to the average. Repeat until the moving average is run through all the trades.
  4. Plot it.
  5. Analyze.

Click on the chart to enlarge…

There have been 4 times in the past 10 years when PDS has seen the 20 trade moving average dip to the current level. From here I expect it to begin to retrace back to the average, which is 1.74%. Should the 20 trade average hang around here for several months or more, or dip significantly lower than -4.00%, it would be abnormal.

20 Trade Moving Average of the Winning %

This metric is calculated the same way as the 20 trade moving average of each trade’s profit or loss.

Again we see that the 20 trade average of the winning % is stretched, but does not appear to have exceeded normal parameters. I expect this metric to begin to climb back to its average of 68.7%.

Dr. Woodshedder’s Diagnosis

My diagnosis is for continued system trading diligence as PDS will likely roar back to life over the next several months. For anyone interested in trying out the system, historically (as the above charts show), now would be an excellent time to give it a try.

Comments »

High Tight Flags for Monday

Bulkowski buys these on an intraday break above the previous closing high. I’m considering altering this rule to buy on the next open after the stock closes above the previous closing high. I do not have anything objective to back this up, yet, but as soon as I do, I’ll be writing about it.

Comments »

Market Breadth Signaling Imminent Bounce

Both short-term and intermediate term breadth indicators are signaling that a bounce is imminent…

The top pane with the red line and gray histogram measures both short-term and intermediate-term breadth. The red line measures the number stocks above their 5 day moving averages while the gray histograms shows the number of stocks in an uptrend. Both indicators are at levels which typically precede a bounce.

The second pane from the bottom, green line, is the Decliners Indicator. Anytime this indicator is above 70, a bounce is likely. Today is the 4th day that this indicator has closed above 70.

Finally, the 52 week high/low indicator is extended far enough beneath its 9 day moving average to signal that a bounce will come soon.

The market has suffered 4 down days in a row, yet has still closed above its 20 and 50 day moving averages. Support is near and the market is oversold in both time and breadth.

Comments »

Power Dip Year to Date Results and Analysis

All models are significantly under-performing SPY (+7.12%) and IWM (+6.79%).

There are several trades that have seriously impacted performance. I chalk this up to bad luck and know that given enough time, there will be good luck trades to balance these out. I say bad luck because typically large, losing trades are spaced out over time, and not grouped together over a couple of months. It is not the large, losing trades that make bad luck. I expect losing trades. Instead, it is the grouping. The system is also experiencing the normal cycle of surge and drawdown. More on this later.

Shameless Plug Alert: If you have been considering trying out this system, the best time to start trading it is when it is in a drawdown. Most people want to start trading a system when it is killing it… On The Power Dip System site, there is a tab labeled “Models” where graphs are housed showing previous drawdowns. The current drawdown from the last equity high is ~17% and looks to be very typical of performance during a market correction. (See larger equity curve, below).

For anyone worried that the system will dip buy itself to death, it will not happen. As a stock must be in an uptrend to meet the buy criteria, during a sustained market correction, there are very few stocks in an uptrend. Thus, the system sits mainly in cash until the market improves.

More analysis after the stats…

YTD: 20% of Equity per Trade

Net % Profit: -7.50%

Annualized: -21.11%

Average Trade: -0.59%

Winning %: 55.93%

———————————————

YTD: 10% of Equity per Trade

Net % Profit: -4.81%

Annualized: -13.92%

Average Trade: -0.40%

Winning %: 58.33%

———————————————

YTD: ATR Position Sizing

Net % Profit: -7.15%

Annualized: -20.19%

Average Trade: -0.98%

Winning %: 57.14%

.01/share was included for commissions.

Analysis:

  • The Winning % has dropped significantly and is due for some reversion to the mean. I expect the Winning % to average  67.5%.
  • The 10% Equity Per Trade Model is out-performing the other models. This tells me that the system has seen large losses in high-ranked picks. Since the 10% Model takes a greater number of smaller positions, it has been less affected by large, losing, high-ranked picks.
  • I will be generating some control charts which will allow me to draw some conclusions about current performance compared to past performance. Specifically, I want to determine if current performance is normal or abnormal compared to past performance. I fully believe that current performance represents a normal drawdown, but a graph is worth one thousand assumptions.

YTD Equity Curve for 20% of Equity Per Trade

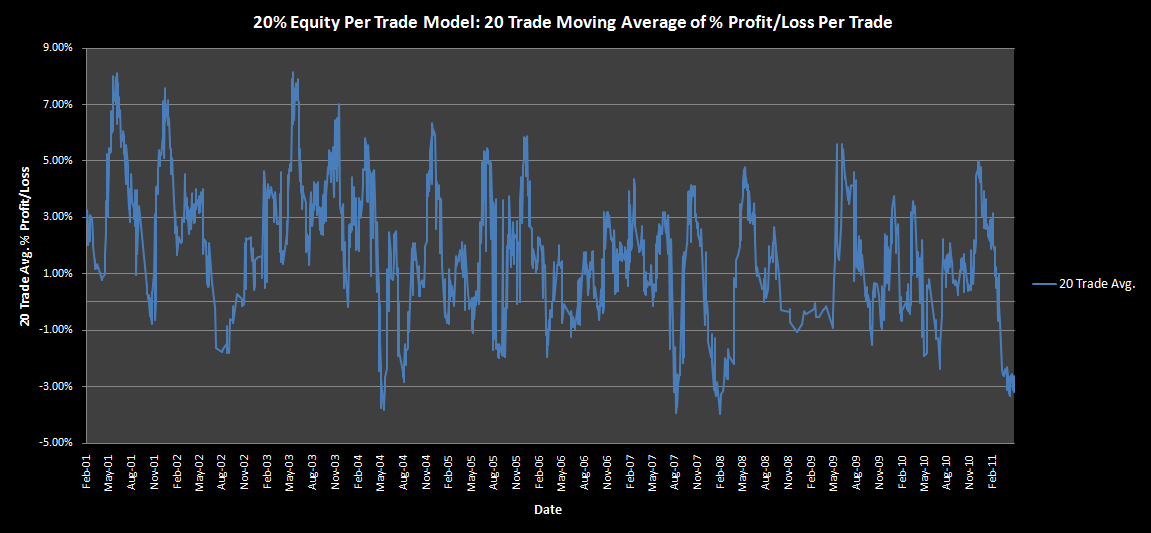
Equity Curve from 1.1.2001 to 5.3.2011

The 10 year equity curve (representing a compounded annual rate of 61.16%) shows the large surge from PDS that started in late 2010 and lasted through February of 2011. After such a surge, a drawdown is not abnormal. In fact, previous surges have resulted in similar drawdowns. Historical backtesting shows that the system has seen similar drawdowns several times over the past 7 years. Evaluated against the big picture, the drawdown shown in the YTD graph does not look nearly as scary. In fact, I look forward to the next surge!

All results are generated from de-listed (free of survivorship bias) stock data.

A free The Power Dip System trial is available.

Comments »