PDS has been suffering a drawdown recently. And while the drawdown appears to be fairly normal, it is always healthy to take a look under the system’s hood, to be sure that everything is okay. Much like a doctor giving a patient an EKG, I have processed crucial data to determine whether or not everything is running within normal parameters. Based on the control charts below, the system appears to be experiencing a normal cycle of under-performance, and does not appear to be developing any abnormal traits.
20 Trade Moving Average of each Trade’s Profit/Loss
I know, it sounds complicated. It is not. Here is how it is figured.
- Get the % profit/loss of each trade.
- Average the % profit/loss of the first 20 trades.
- Create a moving average where the 1st trade is dropped from the average and trade 21 is added to the average. Repeat until the moving average is run through all the trades.
- Plot it.
- Analyze.
Click on the chart to enlarge…
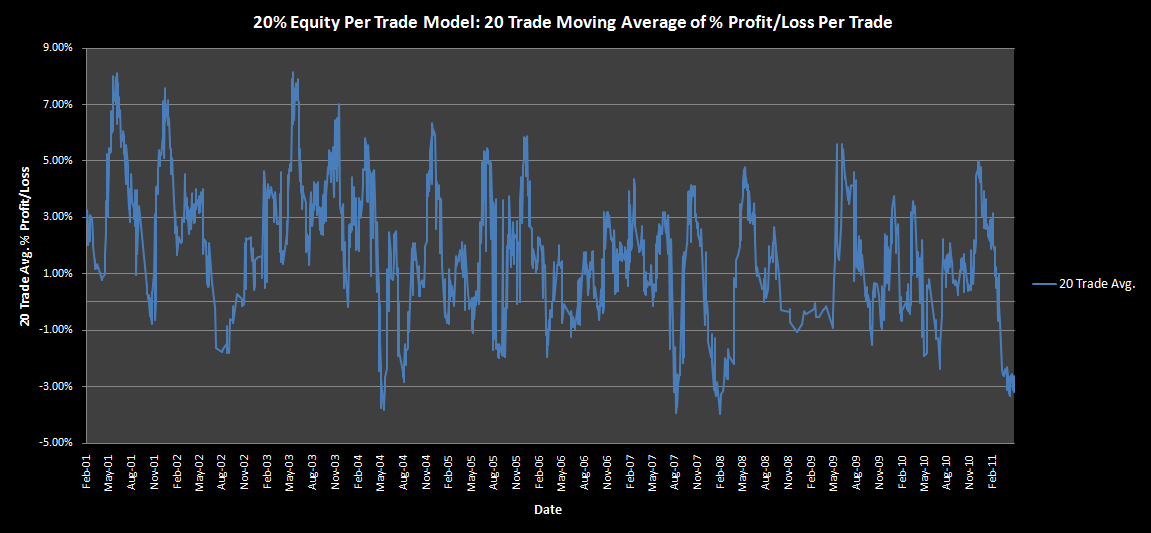
There have been 4 times in the past 10 years when PDS has seen the 20 trade moving average dip to the current level. From here I expect it to begin to retrace back to the average, which is 1.74%. Should the 20 trade average hang around here for several months or more, or dip significantly lower than -4.00%, it would be abnormal.
20 Trade Moving Average of the Winning %
This metric is calculated the same way as the 20 trade moving average of each trade’s profit or loss.

Again we see that the 20 trade average of the winning % is stretched, but does not appear to have exceeded normal parameters. I expect this metric to begin to climb back to its average of 68.7%.
Dr. Woodshedder’s Diagnosis
My diagnosis is for continued system trading diligence as PDS will likely roar back to life over the next several months. For anyone interested in trying out the system, historically (as the above charts show), now would be an excellent time to give it a try.


With respect, does this mean oversold?
Yes 🙂
Interesting.
If you plot the max draw downs over the SPX in 04 there was a bounce and more downside. Aug 07 was the bounce before the top and 08 was heading into the bear.
Well let’s hope it is not predicting another 07-08 type scenario!
Woodshedder, you’re the only system seller I’ve seen that lays out objective, testable criteria for whether their systems still work. Others just kind of assume it will work forever or that “they’ll cross that bridge when they come to it” which is never a safe strategy. With PDS I feel like if it was broke, at least you’d tell us so we could stop losing time and money on it, which is really valuable (nothing’s worse than a system/manager who can’t admit he’s wrong and just keeps losing money). In a sense, you’ve got like the ultimate stop loss, where if the system breaks, you can stop trading it. Of course, I strongly doubt it’ll come to that, but I really appreciate that you’ll be prepared for it if it does.
Thanks Data. I really appreciate that. The thing is, I rely on this system too. It is my favorite, and so far, it is really the best system I’ve been able to develop. If it stops working, I want to know about it! Like you, I certainly don’t want to throw money down a hole. So I keep tabs on things.
I will run the 10% and ATR model too, and if they offer anything substantial that we can learn from, I’ll post the charts.
Interesting note: On 3/3/11, the 20 trade average dipped below 0. At that point, the equity drawdown from the high was only -1.84%. Would have been nice to stop trading there, no? In the future, I will keep a closer eye on such things, in case we want to try and time it somewhat. Unfortunately I can’t backtest that. It would be a “by hand” sort of endeavor to figure out if in the past it did better to stop trading it when it shows signs of underperforming.
Wood – not sure how or if you could plot it, but it seems to my eye that just a few trades have made a large negative impact – OPXT, TA and OCZ in particular. Outlier bell graph of profit/losses perhaps? These things happen. And for everyone one of those, comes a HOTT, et al which eventually balance things out.
Great system and as a user I put my resub money where my mouth is yesterday for a reason.
To be perfectly candid, one of the more challenging aspects of Powerdip is the occasionally overwhelming number of candidates to choose from. And seeing how many trades look to close here shortly, I’m thinking the profit and winning % averages are just about to take a large spike upward…..
Lastly, all I can add to what Data said is “indeud”…..
Cheese aka Iamtj63
Cheese, absolutely, a few negative trades had a large impact. Let’s hope you’re right about the averages taking a large spike upward. I believe you will be.
Thanks Cheese!
INDEUD!
(laughter) you could go to town on that thing with Time Series analysis…I can picture old professors getting giddy at the site of those charts.
lol…they are pretty cool. When I discovered that one could run control charts for trading systems, I was giddy too!
haha, as an aside, I can’t believe I spelled sight* wrong.
Guna B won of those days, Wood…