iBankCoin
Joined Nov 11, 2007
1,458 Blog Posts

Fade the Bears and the 200 Day Average

The 200 day moving average is fast approaching. Bears are hoping the markets melt right through it. Bulls are watching for support.  Should SPY close beneath the 200 day moving average, the results below suggest the bears may want to cover their shorts and go long.

The 200 day moving average is widely seen as the bull/bear market demarcation. Trade above it and the bulls charge. Trade beneath it and the bears roar. In reality, it is not that simple. Most of the time the market doesn’t trade for an extended period of time beneath the 200 day average. Years such as 2008 tend to be the exception, not the rule.

With the market quickly approaching the 200 day average, I wanted to see if a close beneath it would be a good short signal.

The Setup:

SPY has traded above the 200 day moving average for 190 days. While this may seem like a long time, on 8.26.1998, SPY had traded above the 200 day for 525 days. Anyway, the setup requires that SPY has traded above the 200 day for more than 100 days.

The Rules:

  • Setup (as described above) has occurred
  • Buy SPY at close when it closes beneath the 200 day moving average
  • Sell X days later
  • No commissions or slippage included
  • All SPY history used

The Results:

Summary of Results:

Sample size is small here, with only 8 occurrences. However, all 8 were winners.

Requiring ONLY a close beneath the 200 day average (the blue line) results in 25 occurrences, which gets closer to possible statistical significance.

I wondered how this system could produce 100% winners, especially after trading through 2008. What I noticed is that the first time the market breaks down beneath the 200 day average, it tends to bounce. Subsequent breaks of the average is when the serious damage can occur. As the system only holds for 50 days, it has managed to avoid the slide into Armageddon.

Bottom line: Ignoring the small sample size, the markets may be setting up for a trade with a significant bullish edge.

Comments »

SPY > 1.0% Beneath Lower Bollinger Band…Buy or Sell?

With SPY still sliding down the lower Bollinger Band, I aim to take advantage of the situation with more Bollinger Band what-if posts.

Previous- SPY Closes Twice Beneath Lower Bollinger Band

On Friday, SPY closed more than 1% beneath the lower Bollinger Band. What does this portend for the next several days and the next few weeks?

Rules:

  • Buy SPY at the close if it closes more than X% beneath the lower Bollinger Band
  • Sell X days later at the close
  • No commissions or slippage included
  • All SPY history used

Results:

Summary of Results:

Based on these results, a bounce of .75% – 1.0% is expected within the next couple of days. Note that the average next day return for all the tests is greater than 0.5%.

After a bounce, as with the earlier Bollinger Band tests, we should expect more downside. Best case scenario will be that the market consolidates after the bounce.

The results show that the farther the close is extended beneath the lower band, the greater the downside ahead. With Friday’s close a tad greater than 1.0% beneath the band, we are in the sweet spot.

The bottom line is that as long as SPY is sliding beneath the lower Bollinger Band, we should expect the slide to continue. As soon as we get a couple of weeks or three above the lower band, I expect the results 50 days out to look better than they do right now.

Comments »

Power Dip Setups at One Year Low

Dip buying when the market is continuing to fall requires confidence. I would not continue to dip-buy into a multi-month market collapse. One of the things I like about PDS is that when the market gets weak enough, the system will quit giving signals. The reason for this is simple. Since the system only buys stocks in an uptrend, a market that falls long enough will eventually erase most if not all uptrends.

Currently, the number of stocks in an uptrend (as quantified by the system) is 131. This metric has not seen such low levels since the summer of 2010.

We are looking at the bottom pane of the chart. This metric has also been a fairly good at marking bottoms.

Notice that beginning in 2008, the number of PDS setups was fewer than 100. It does build up slowly to almost 500, but then as the market begins to fall away again in June, the number of setups get fewer and fewer until on October 10th, 2008, there were only 17 stocks in an uptrend. Keep in mind that just because it is in an uptrend doesn’t mean that the system will buy it. It has to dip first, and when it does, it must not violate other criteria in order to count as a true Power Dip.

If the market continues to slide here, PDS will be issuing very very few picks, and subscribers will be mostly in cash. If the market stabilizes or bounces, the number of picks will climb. Either way, knowing this gives me the confidence to keep buying dips, even as the market is falling.

Comments »

Comcast’s Negligence Killed My Television

Be sure to read The Important Matter of Surge Protection for the necessary background information pertaining to this post…

Journey Through Multiple Layers of Customer Service Hell…

So when we left off, I had filed a damage claim with Comcast, on the evening of June 5th. The customer representative, Richey, the guy with a strong Puerto Rican accent, assured me I would receive a call from Comcast on Monday. Well Monday came and went, and I did not receive a call. I called Comcast back on Monday evening and spoke with Samantha. Her customer service skills were excellent, which was valuable since she told me that Richey never filed the damage claim. Samantha took very good notes and filed a claim for me. She read it back to me, and it was very accurate. After giving me a reference number for my claim, she assured me that someone would call me on Tuesday.

Tuesday came and went, and I received no phone call from Comcast. Today, (Wednesday, June 8th) I called Comcast at approximately 9:30 a.m. I spoke to a “new” (his words) representative who took two forevers to handle my issue. He must have been consulting the trainee manual or speaking with supervisors because I was on hold for a long, long time. Upon his return, he informed me that he was putting an alert in the system and that someone would call me back within 2 hours. At 1:30 p.m. I had received no call from Comcast, so I called back and got a more experienced representative who told me the same story as the first: “I’m putting in an alert to the supervisors. This will get their attention and someone should call you back within 2 hours.” I left work at 5:00 p.m. and had not received a call. Every time we spoke I was giving the reps my work number.

I got home and almost immediately called Comcast. This time I chose the selection for I Want To Disconnect My Service. I was connected, (much more quickly this time) with Ernest. His company abbreviation is SLV1AV. I told Ernest that I wanted to disconnect my service since Comcast refused to call me back. Ernest explained “an email” had been sent at 5:00 p.m. I have no idea who sent the email or what it was about, but Ernest seemed to believe it was important. He asked again what the problem was, and I again explained that Comcast’s negligence had resulted in my T.V. being ruined. I explained this in detail, and included anecdotes about other households in the neighborhood that lost TVs. I made sure to tell him that when my wife went to pick up the new cable box at the Comcast office that there was a lady there who had lost 3 TVs, all expensive. She was in tears. There were two other customers with similar stories. Since the line was stretching out of the building (with each customer returning a Comcast set-top box), there may have been more that lost TVs. Ernest did not remark on this. He instead explained that within 48 hours, “inspectors” would come out to my house. He said he was including “a tickler” (his dumb words, not mine) in my file to remind him to call me around 3:00 p.m. on Friday to make sure the inspectors had actually stopped by my house.

Let’s Examine Comcast’s Negligence

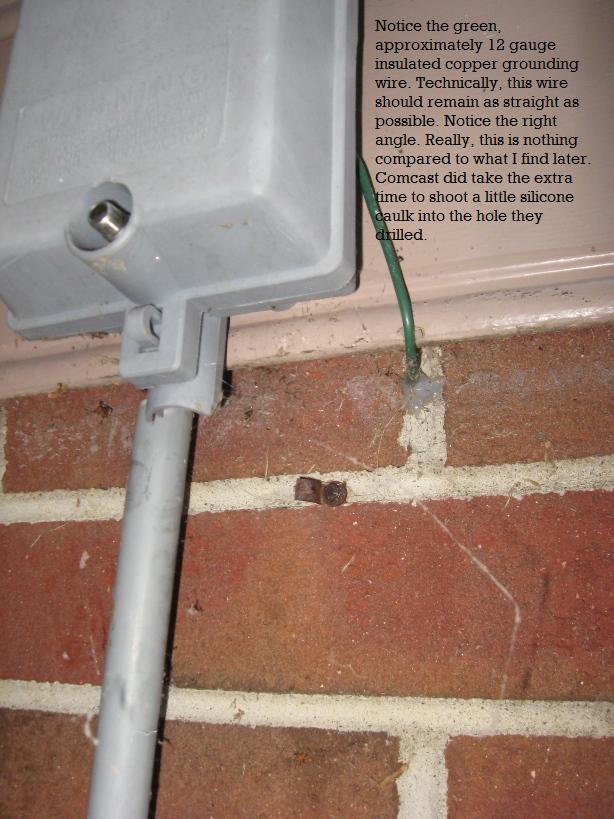
On Monday morning (June 6th), I went outside and took photos of Comcast’s grounding box. I was pretty sure there would be no grounding wire. I was wrong.

Click on the photos to enlarge…


Although there was a grounding wire, I was positive that there was a problem somewhere. Unless your house gets hit directly by lightening, there is no way a surge can enter your home via your CATV cable, blowing out the cable box and the TV, if the cable is properly grounded.

On Monday I had no way to know that Comcast would avoid my damage claim, so I did not take any more pictures. Today, when Comcast said they would send out the inspectors, I knew I had to get under the house to ascertain just exactly what their installers did wrong.

Detour Into National Electrical Codes…

Codes for installation of grounds are notoriously complex and confusing. I will try to keep it simple. Below is the general code for grounding communications equipment:

Telecommunications systems [800-40(b)], antennas and lead-in cables [810-21(f)], CATV [820-40(b)], and network-powered broadband communications systems [830-40(b)] must all be bonded to one of the following locations:

1. Building or structure grounding electrode system as described in Section 250-50.
2. Interior metal water pipe meeting the requirements of Section 250-104(a). The limitation of 5 feet in Section 250-50 does not apply.
3. Metal service raceway.
4. Service equipment enclosure.
5. Building or structure grounding electrode conductor.
6. Metal enclosure enclosing the building or structure grounding electrode conductor.

7. Accessible bonding means such as six inches of No. 6 copper conductor connected to the service equipment or raceway [250-92(b)].

We want to focus on #2. Here are the requirements for using an interior metal water pipe as a grounding electrode:
  • A metal underground water pipe (10’ in the earth or longer) can only be considered as a grounding electrode for the first 5 ft. of its length within the building. Art. 250.52(A)(1).
  • A non-metallic underground water pipe is not a grounding electrode and the interior metal water piping that it supplies is not a grounding electrode and cannot be used as a means to connect other grounding electrodes together. However, this interior metal water piping must be bonded to the service in a manner specified in Art. 250.104(A).

    Okay, in layman’s terms, if you have a metal water pipe that has 10 feet or more of its length buried in the earth, it can be used as a ground. For CATV, the copper wire from the grounding block DOES NOT need to connect to the metal water pipe within 5 ft. of its length within the building. If water is brought into your house via a plastic pipe, your interior copper pipes cannot be used as a ground.

    Back to Comcast’s Negligence…

    So let’s take a look under my house to see if Comcast met the National Electrical Codes.

    So far, everything looks good. The ground wire is attached to the copper water pipe. Lets look at another angle.

    Again, we see the ground wire clamped to the copper pipe. Unfortunately, had the installer looked down about 5 feet ahead, he would have seen this:

    Note what is emerging from the ground. Also note how close the existing ground connection is to where the blue plastic water pipe comes out of the ground.

    Now let’s look at the big picture:

    Obviously, Comcast has not connected the ground to metal piping that is buried underground for at least 10 feet. What exactly is being used to ground my CATV/Broadband?

    Nothing like an old, dry-rotted garden hose to conduct electricity.

    What Will the Comcast Inspectors Determine?

    I am not an electrician. Perhaps there is something I have missed. Perhaps I have misunderstood the electrical code. Assuming I am correct, will Comcast reimburse me for the damage this caused to my television? Look for an update on Friday, June 10th.

    [polldaddy poll=5126407]

    Comments »

    SPY Closes Twice Beneath Lower Bollinger Band: Bullish?

    Last night’s post looked at what has happened in the past when SPY closed beneath the lower Bollinger Band. Tonight’s post updates the previous research to include a 2nd close beneath the lower Bollinger Band.

    Ideally, we would have bounced today and closed back above the lower Bollinger Band (50,2). In fact, the market was trading above the lower band until the Bernanke speech derailed the rally. This action was disappointing and a bit troublesome.

    Since the bands I’m using mark 2 standard deviations below the mean, sustained trading in this area represents an abnormal market. Similar to when the market closes above the upper Bollinger Band, trading beneath the lower band for any length of time can signal that it is a bad time to be looking for a sustained bounce. Tonight’s research demonstrates this principle. Observe the difference in near-term market performance when the market fails to bounce and close above the lower Bollinger Band on the 2nd day.

    This is the same graph from the previous post updated with tonight’s research.

    Note that while we are still looking for a bounce over the next couple of days, the intensity of the bounce has been decreased. Bounces after 2 closes beneath the lower band have had a hard time holding onto gains.

    Unless something changes, and quickly, it appears that the next 20 days of trading could find us trading lower or consolidating around today’s close, give or take a percent or so.

    On the bright side, if past history is any indication of the future, we should be higher than today’s close sometime after July 4th.

    On the dark side, we could be starting an extended slide down the lower band. I’m a big believer in symmetry and am worried that after our 3 month melt up along upper band from December 2010 through February 2011, we might have to spend some time melting down along the lower band.

    Comments »

    SPY Close Beneath Lower Bollinger Band: Bullish?

    SPY closing beneath the lower Bollinger Band creates a bullish setup for the next 1-3 days.

    The Setup:

    Today SPY closed beneath the lower Bollinger Band, 2 standard deviations below a 50 period mean (50,2). See chart below. The chart looks nasty, but testing this setup shows how we can be fooled by how things look on a chart.

    The Rules:

    • Buy SPY at close when it closes beneath the lower Bollinger Band (50,2).
    • Sell at the close X days later.
    • No commissions or slippage included.
    • All SPY history used.

    The Results:

    Summary of Results:

    This study has a decent sample size with 102 occurrences of this setup. The next day edge is very strong but any gains from an immediate bounce have been worn away after a week and a half (8 days).

    The results suggest that there is a good chance that the markets will see a close lower than today’s close sometime in the next month. However, over the intermediate term, this setup suggests the possibility of gains of 2% or more above today’s close.

    Comments »