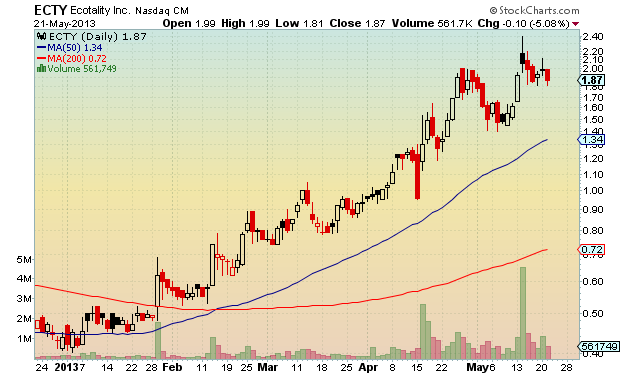
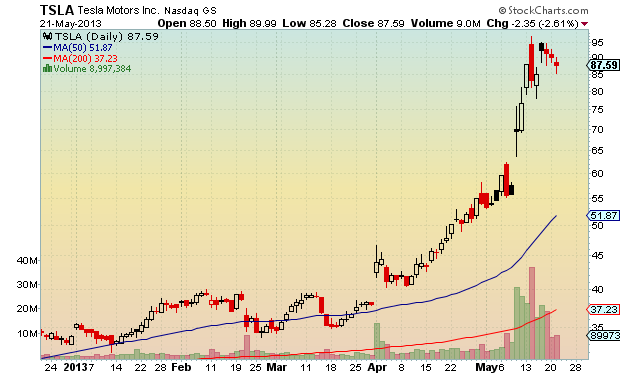
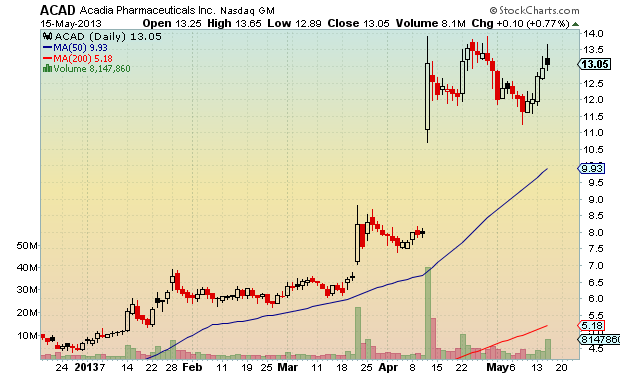
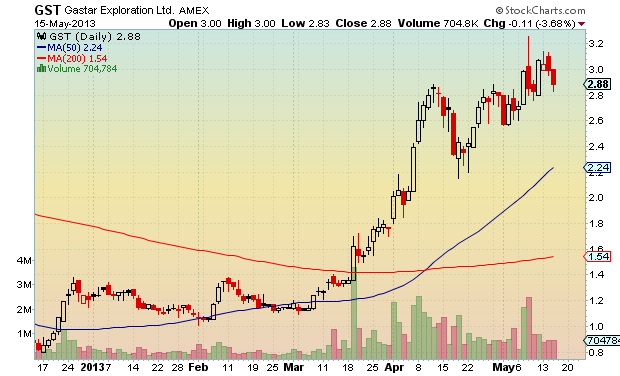
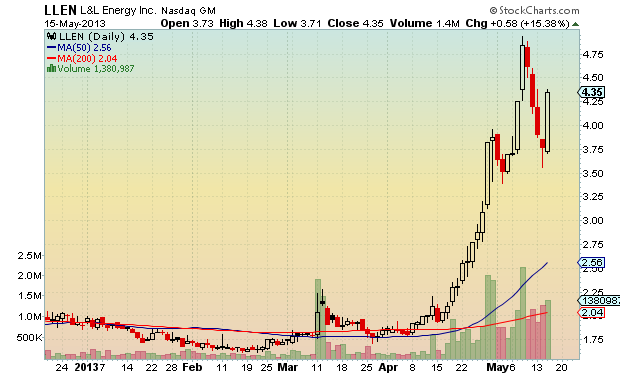
Some good looking high tight flags in tonight’s installment…


We are entering historic territory with the S&P 500 closing for the 12th consecutive day above its upper Bollinger Band (50,2). This has only happened 25 times since 1928. When the market reaches historic extremes, it is ordinary to wonder what it all means. Let’s take a look.
The Rules:
The Results:
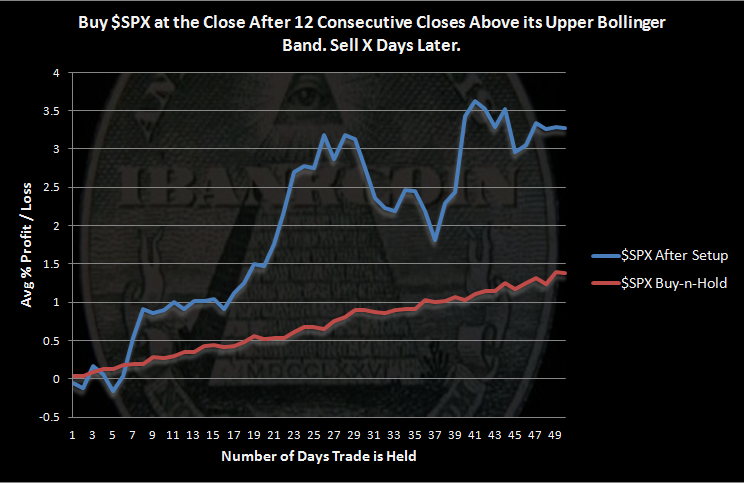
With only 25 samples, we should be careful about drawing conclusions from these results.
If we ignore the amount of time this rally has persisted and only consider the number of consecutive closes above the upper Bollinger Band, we see that in the past the rally has been able to continue.
The $SPX buy-n-hold results were created by cutting the history into 50 day segments and then averaging those segments together.
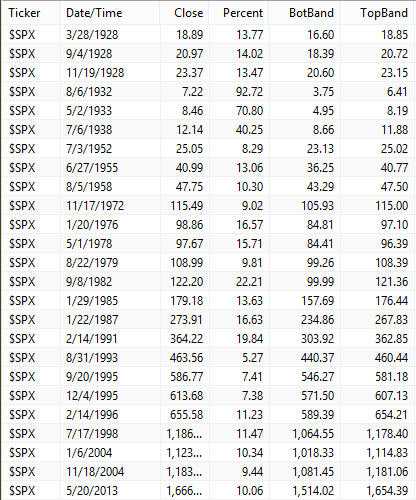
For those who might be interested in digging a little deeper into this setup, I’ve posted below all the previous instances.
Yes, the market is going up, up, up. Hopefully you are fully invested and have been so for months.
We have taken a few days off to go to Myrtle Beach for a baseball tournament at the Cal Ripken facility here. With the market at highs, I thought I’d post a few shots from the top of one of the tallest condos in Myrtle Beach.

That shot is looking towards North Myrtle.

Walking out on the balcony feels like you will fall right into the Atlantic. You cannot see beach until the last couple of steps.

This shot looks south, towards Surfside.
The bracket has 12 teams. The top 4 will advance to the championship on Sunday. Our experience is that the teams that compete here are top notch. Wish his team some luck!
Comments »
On Wednesday, May 15th, $SPY closed 3.52% above its 20 day moving average. While this has happened more than 275 times over the history of $SPY, it is not an altogether common occurrence. It is the first time this has happened in 2013, and it did not happen at all in 2012. A quick glance at the list of these events appeared to show some clustering.
So what happens next? Let’s take a look at what happens over the next 50 days.
The Rules:
The Results:
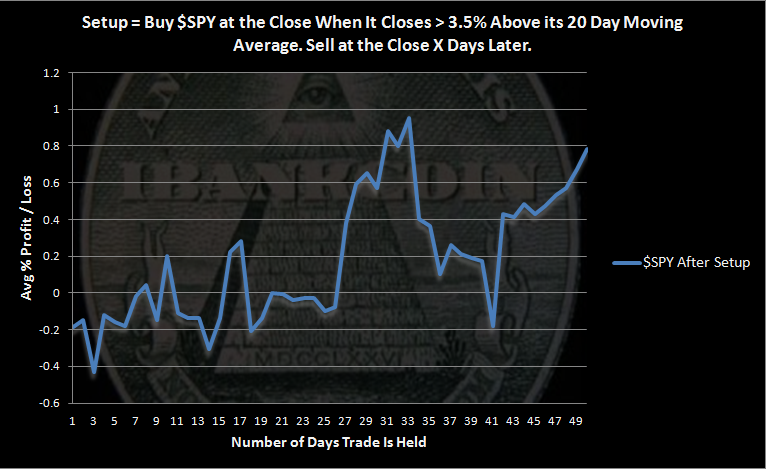
While there were 275 occurrences, if we instead look at trades, there were 169 trades held for 1 day and 35 trades held for the full 50 days. This means that there is some clustering occurring. It also means that the further we go out towards 50 days, the more volatile results become, simply because there are fewer trades to average together.
The graph shows that this setup is neutral to slightly bearish. The return is no where near to matching a buy-n-hold return over the same time period. In fact, the return after this setup is about half of what we’d expect after holding $SPY for 50 days.
With $SPY having closed 10 days in a row above its upper Bollinger Band (50,2), many traders are expecting some consolidation. Others are calling for a fairly serious pullback. These results show that in the past, consolidation has been much more likely than a serious pullback.
Comments »I’m surprised at the lack of high tight flags. Perhaps the majority of them have already broken out and what we have left are only the laggards?
I have been trying to replicate ETF HQ’s TransDow strategy. It is a neat idea, and the simplicity appeals to me. Beyond that, I’ve been working with AmiBroker to get better at coding in multiple time frames. Because this strategy uses weekly closes, I thought it would be good practice. The problem is that I cannot get my results to be any where near ETF HQ’s results. My guess is that my code has an error, but for the life of me, I cannot figure it out.
After emailing with ETF HQ, I was able to determine that their coding has the week close on Monday while my code uses Friday as the last day of the week. This should not make that much of a difference.
The AmiBroker code is below. I have put it within the WordPress quote function, so it should be able to be cut and pasted without error.
*Update* It will not cut and paste without error. The problem seems to stem from the quotation marks. I’ll leave the code here so that others can peruse it. Email me woodshedder73 at google mail and I’ll send the .afl file as an attachment.
/*TransDow as described by Derry Brown: http://etfhq.com/blog/2013/05/04/market-timing-through-market-dominance-transdow/?utm_source=feedburner&utm_medium=feed&utm_campaign=Feed%3A+EtfHq+%28ETF+HQ%29
*///Boilerplate options
SetTradeDelays( 0, 0, 0, 0 );SetOption( “InitialEquity”, 10000 );
SetOption( “MinShares”, 1 );
SetOption( “MinPosValue”, 0 );
SetOption( “FuturesMode”, False );
SetOption( “AllowPositionShrinking”, True );
SetOption( “ActivateStopsImmediately”, False );
SetOption( “ReverseSignalForcesExit”, False );
SetOption( “AllowSameBarExit”, False );
SetOption( “CommissionMode”, 3 );
SetOption( “CommissionAmount”, 0.0 );
SetOption( “InterestRate”, 0 );
SetOption( “MarginRequirement”, 100 );
SetOption( “MaxOpenPositions”, 1 );
SetOption( “UsePrevBarEquityForPosSizing”, True );RoundLotSize = 1; // 0 for Funds, 100 for Stocks
TickSize = 0; // 0 for no min. size
MarginDeposit = 0;Totalpositions = 1;
PositionSize = -100/TotalPositions;// Weekly Bars //
Time=inWeekly;
TimeFrameSet(Time);
DJI=Foreign(“$DJI”, “C”);
DJT=Foreign(“$DJT”, “C”);
Ratio=DJT/DJI;
Ratio10=MA(Ratio,10);
TimeFrameRestore();
RestorePriceArrays();Ratio=TimeFrameExpand(Ratio,Time);
Ratio10=TimeFrameExpand(Ratio10,Time);Buy=Cross(Ratio,Ratio10);
Sell=Cross(Ratio10,Ratio);BuyPrice=SellPrice=Close;
ApplyStop(stopTypeLoss,stopModePercent,4,0,False);
Plot(Ratio, “Ratio”,colorYellow,styleLine);
Plot(Ratio10, “Ratio10”,colorGreen,styleLine);
Filter=True;
AddColumn(Ratio, “Ratio”,1.5);
AddColumn(Ratio10, “SMA10″,1.5);
AddColumn(Buy, “Buy”);
AddColumn(Sell, “Sell”);
Let me know in the comments if there are any questions about the code. My data provider uses $DJI for the Dow Jones Industrial Average and $DJT for the Dow Jones Transportation Index. These symbols may have to replaced with whatever symbol your data provider uses for the $DJI and $DJT.
Comments »After months of defensive sector utility funds moving up to populate the majority of the top fund rankings, within a couple of weeks, these sector funds have dropped completely out of the rankings. As of last night, Utilities were still in the top three. After today’s trading, it is ranked 7th.
The top 5 funds are now all pursuing a similar theme. I think you’ll be able to discern what it is…
Any guesses as to why the top 5 is almost all following a similar theme?
The system is currently long FSUTX (Utilities, but will be rotated out of and into FSPHX tomorrow); FBMPX (Multimedia, but will be rotated out of and into FPHAX tomorrow); FBIOX, which will be held since it is still in the top 3.
The system is up 14.5% YTD, compared to $SPY, which is up 14.8% YTD.
Comments »