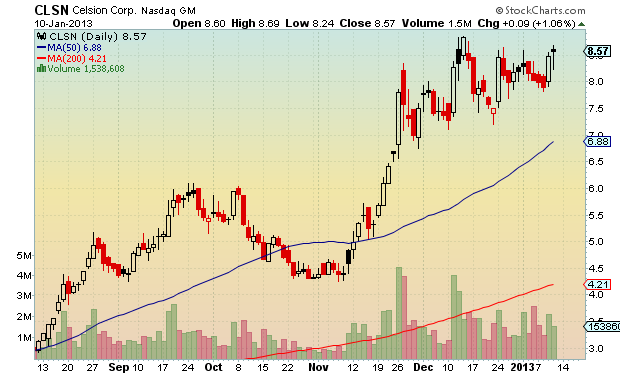
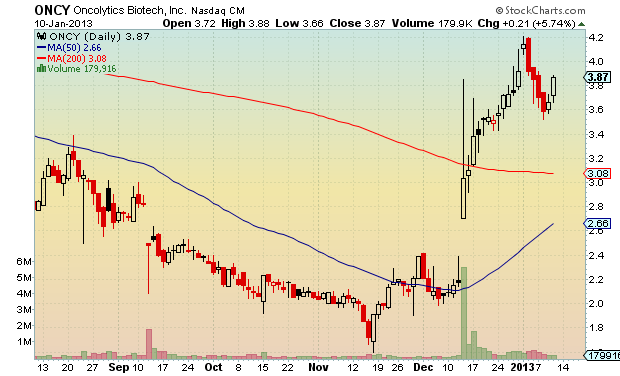
Some nice looking new High Tight Flags…
Have a great weekend!
Comments »If $SPY can close above $147.24, just pennies above today’s close of $147.08, it will be its highest close since December 31st, 2007. Assuming there are 252 trading days per year, this would equal a 1267 day new high.
What has happened in the past when $SPY was making similar new highs?
It just so happens I have a previous study which demonstrates this.¹
——————————————————–
On Thursday, March 15th, the S&P 500 made a new 900 day high. With the S&P 500 re-visiting prices it hasn’t seen in almost 5 years, I thought it would be interesting to look at what happens after the index makes significant new highs.
The Rules:
Buy SPY at the close if
Sell SPY at the close Y days later.
No commissions or slippage included. All SPY history used.
The Results:

Thoughts and Caveats:
Because the market was making significant new highs in October of 2007, the results show the impact of the bear market, starting around day 65. As the trades are being held for 100 days, any trade initiated in October 2007 was held through the beginning of 2008. Ouch.
On the brighter side, a new high of 50 days or greater has seen a surge during the last 25 days of the holding period. This surge appears to be the relatively normal result of buying during a bull market.
It should be noted that a new 900 day high generated the highest return.
Sample size grew as the X day new high number decreased.
The Buy-n-Hold return was calculated by chopping SPY performance into 100 day segments and then averaging those segments.
The bottom line is that save for a new Armageddon a la 2008, the market has tended to keep climbing after making a significant new high.
¹ This study does not show the conclusion of the trade that was initiated on March 15th. After 100 days, the March 15th trade was .2% lower. This will bring down the New 900 Day High average trade reflected in the graph.
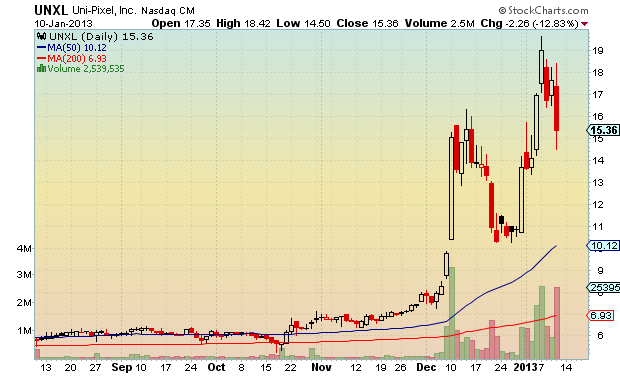
Comments »This has been one of those stocks that has just felt right, from the very start.
It broke out today and closed above the high of the flagpole. According to Bulkowski, the average rise for a high tight flag that has broken out above the top of it flagpole is 27%.
Comments »The system will be rotating at today’s close out of 2 of the 3 funds it is holding and into 2 new ones. It will be selling FSHOX (Construction and Housing) and FSPCX (Insurance) and replacing those with FSAIX (Air Transportation) and FSLBX (Brokerage and Investment Management).
The top 5 ranked Fidelity Select Sector Funds are as follows:
FSAIX (Air Transportation)
FSAVX (Automotive)
FSLBX (Brokerage and Investment Management)
FSHOX (Construction and Housing)
FSVLX (Consumer Finance)
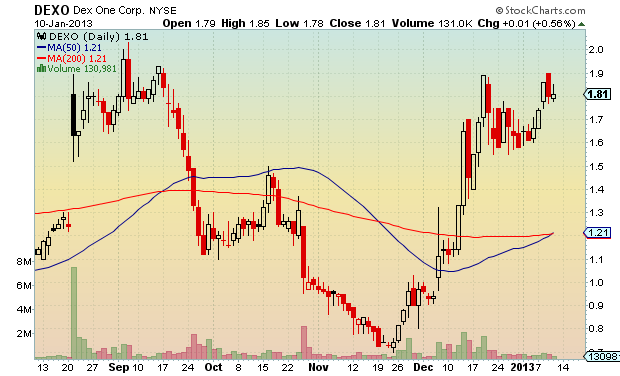
Comments »Here are the two stocks that made tonight’s High Tight Flag screen.
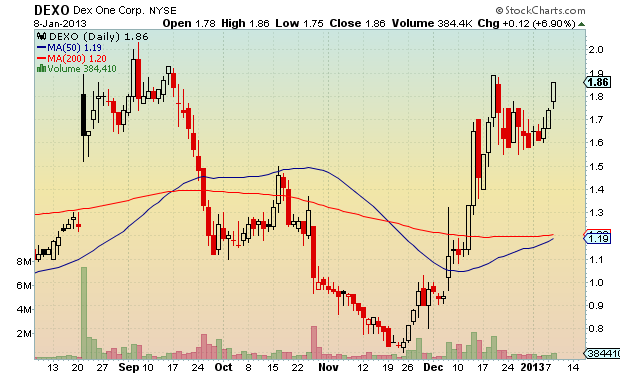
$DEXO consolidated after more than doubling in less than a month. Trading at $1.90 or above will mean the stock has broken out from its high tight flag.
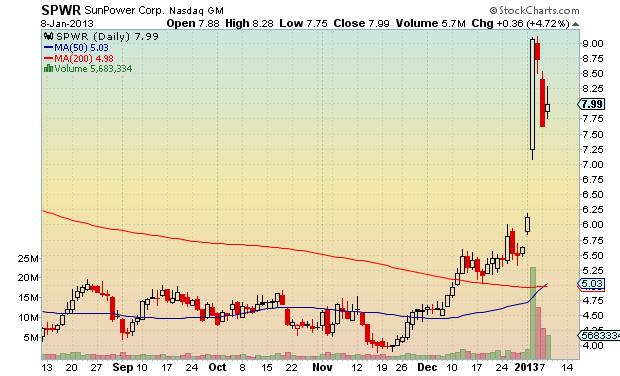
$SPWR looks to be consolidating. The technical breakout point for this is $9.08, but there is a lot of money to be made trading this one up to the breakout poit.
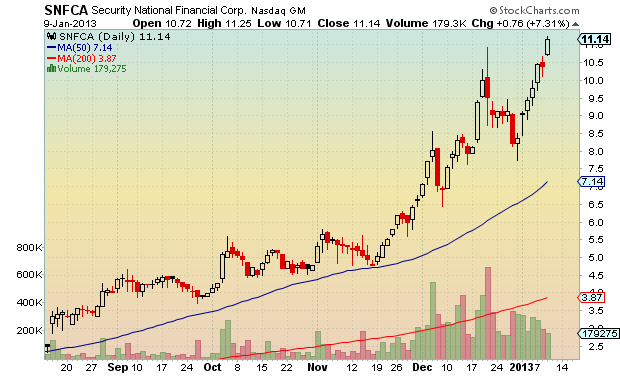
Comments »$SNFCA recently made the high tight flag screen, and began a moonshot the very next day. It is up over 15% since I first posted about it.
HTFs that shoot up like this one has can easily double in a short period of time. Keep an eye on it.
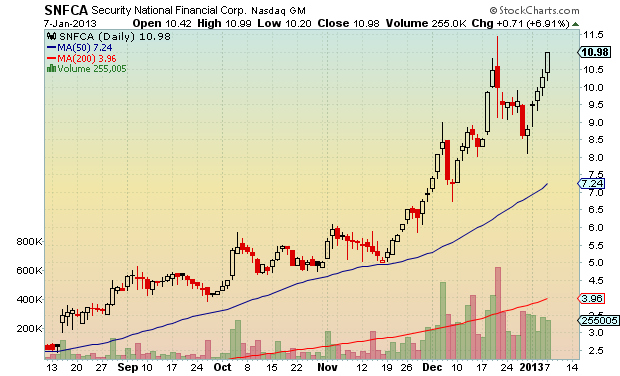
The technical breakout point for this one is $11.47.
Comments »I’ve been exploring the Empiritrage site over the weekend. There is some good reading there for us rule-based, quantitative system traders. I will be writing this week about one of their ideas.
Empiritrage has recently posted an article called Welcome to the Hedge Fund Hurt Locker. I’m going to post a small excerpt because I found it to be hilarious.
When assessing your investment management relationship, utilize this simple formula to determine your expected performance:
E(R)=R(m)-.1?Y (n)-.1?H(n)-Fees
Where, E(r) is the expected return, R(m) is the return on the broad market, Y(n) is the number of yachts the investment manager owns, H(n) is the number of vacation homes, and Fees represent the annual fees (both management and performance fees). Here is an example: R(m) = 10%, the manager has 5 yachts, 1 vacation home, and fees are 2%. The expected return would be .10-.1*5-.1*1-.02= -52% / year. Patent Pending.
🙂
Comments »