I was reading a post from EconomPic called Checking in On the World’s Greatest Rotation Strategy. This strategy is essentially just Sell in May and Go Away, but has one buy the Long government / credit bond index rather than just sitting in cash from May – October.
Oddly enough, I had never tested this simple strategy before, and the results EconomPic posted were good enough that I had to take a look under the hood to see exactly what was making this system run.
The Rules are simple:
- Long $SPY from the close of the last trading day of October through the last trading day of April.
- Long VBLTX (Vanguard Long Term Bond Index Fund) from the last trading day of April to the last trading day of October.
- First day of test is 6.20.1996. Last day is 3.29.2013. First day is first day of history for VBLTX.
- No commissions or slippage included.
The Results:
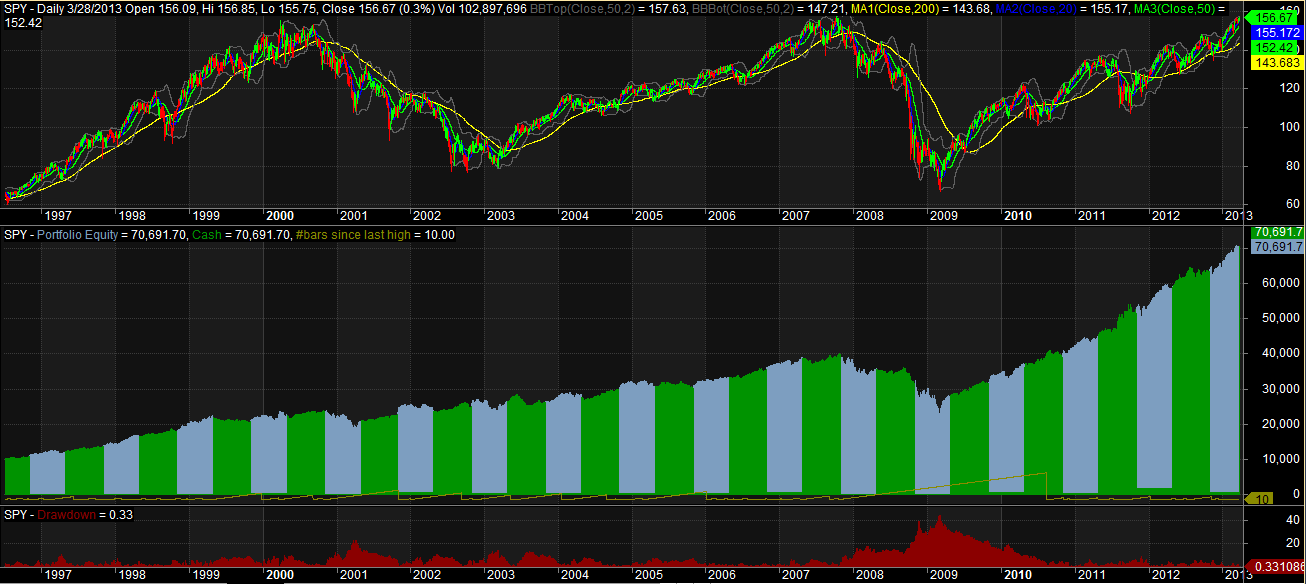
The top pane is $SPY. The middle pane is the equity curve for the strategy. The lower pane shows the drawdowns in percentage terms. The blue portions of the equity curve represents time in $SPY while the green represents time in VBLTX.
Statistics:
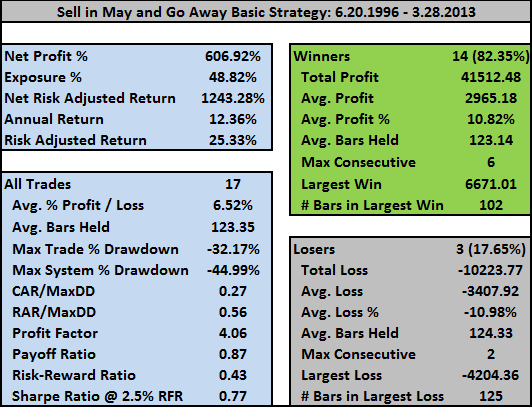
Because of the way I coded his, all the trade information pertains only to the $SPY trades. The returns from VBLTX are built into the overall returns but are not considered to be trades. Perhaps in future tests I’ll break out both $SPY and $VBLTX as separate trades.
If I subtract out the added return from VBLTX, the annualized return from just holding $SPY is 8.82%.
$SPY buy and hold over the same period is 5.26% with a maximum drawdown of -56.47%. So even if you do not rotate into a vehicle to provide a return on your cash, you still beat buy and hold just by selling in May.
Historical Profit Table:
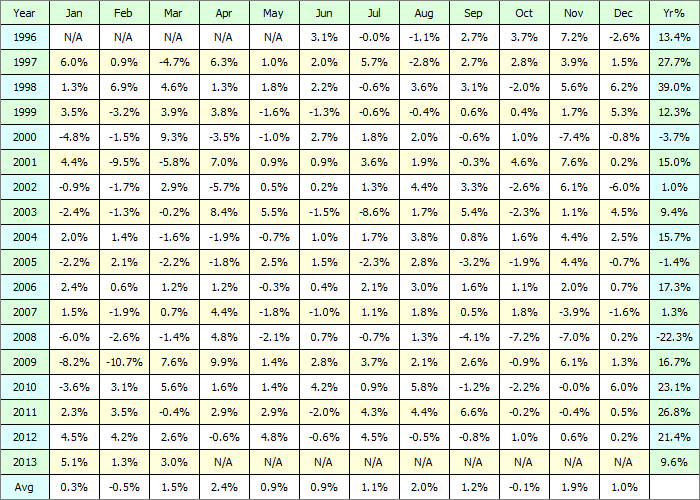
This strategy has just been killing it. I’m leery to assume it can continue killing it. Some questions:
- Assuming government credit / bonds do not continue to perform as well, with what would we replace VBLTX?
- Can we add additional robust timing mechanisms to improve performance of $SPY and/or VBLTX?
I’m looking forward to reading your ideas on these questions in the comments.
The next post will add in an additional timing measure for $SPY.
Comments »