iBankCoin
Joined Nov 11, 2007
1,458 Blog Posts

40 Days Without a 1% Pullback: Bullish or Bearish?

Today, 2.27.12, marked the 40th day since SPY has had a pullback greater than 0.99%. Is this setup bullish or bearish over the intermediate term?

The Setup:

Buy SPY at the close if

  • today is the 40th day since a pullback greater than 0.99%
  • sell the position X days later

No commissions or slippage included. All SPY history used.

The Results:

Pretty interesting, eh?

There were 15 instances of this setup.

The SPY Buy-n-hold results were generated by dividing the SPY history into 50 bar segments and then averaging the results of all the segments.

Slightly Off Topic:

Good begets better. Strength begets more strength.

It makes me think about kinetic energy: For an object that is moving the kinetic energy equals one-half times the mass of the object times the square of the speed of an object, or Ek=(1/2)mv².

I have my thoughts on this, but am curious to hear yours. What metric for SPY would be substituted for mass (m) and what metric would be substituted for speed (v)?

Comments »

Testing An Asset Class Rotational Model that Trades ETFs – Part 2

Link to Part 1

There may have been some confusion on the hold time before rotation. The system will hold each ETF a minimum of one month before re-ranking them and either rotating out and into a different ETF at the close of the month or holding the existing position(s) for another month.

Let’s Make it Better

At the conclusion of Part 1, I alluded to two additional factors that improve the performance of the system. The two factors are including a return on cash and implementing a moving average filter.

The return on cash code for Amibroker is available for free over at AmibrokerU. Simply register and then follow the links through the Free Library. These tests will show the result of using either $SHY (i-Shares Barclays 1-3 Years Treasury Bond ETF) or $TLT (i-Shares Barclays 20+ Years Treasury Bond ETF).

The moving average filter has the system rotate out of a position if the monthly close is beneath a monthly moving average. The results below will show a 4 month moving average.  The 4 month is optimum, but the next best monthly moving average periods to use are 5, 3, 6, 7, 8, 9, and 2, respectively. What this demonstrates is there is a fairly generous range of monthly moving average periods to use. While 4 is optimum over the test period, it may still prove to be robust going forward. One my choose to err on the safe side and choose a 5 or even 6 month moving average period.

Results:

We see all metrics have improved over the model in Part 1, especially the maximum system % drawdown.

For fun, let’s use $TLT rather than $SHY for our return on cash.

These results with $TLT may not be generalizable since $TLT has been a standout performer due to the recent market environment.

The following charts/graphs were generated using $TLT for the return on cash.

Equity Curve:

Note how $TLT allowed the system to gain ground when it would have been in cash (green areas), especially in 2003 and the end of 2008.
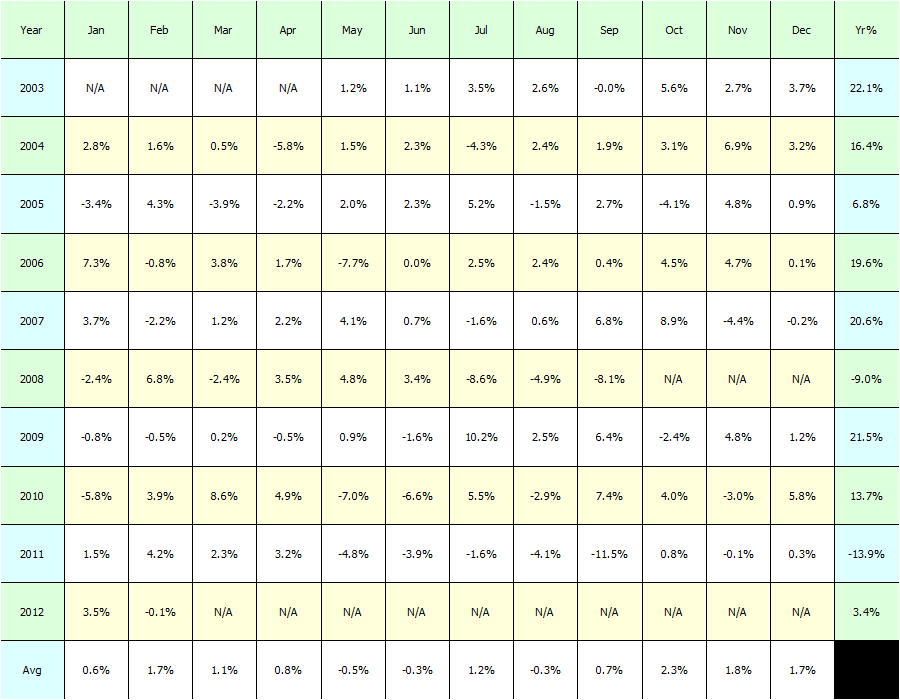
Historical Profits:

Thoughts:

All the caveats noted in Part 1 still apply.

For fun, I added in commissions of $7.95/trade, and they lowered the annual return to 16.36%. Using an Interactive Broker’s commission of .005/share lowered the annual return to 17.41%, or a reduction of -0.05%.

Some helpful comments with suggestions for improving performance were left in Part 1.  Based on those suggestions, I’m going to make some tweaks to the system and report results. If you have any ideas, feel free to leave them in the comments section.

Comments »

Testing An Asset Class Rotational Model that Trades ETFs

There are literally hundreds of research reports out there that demonstrate the ability of relative strength (momentum) strategies to beat the market. The latest one I read is here, and it is highly recommended. I plan to continue testing and development of relative strength rotational models as I feel confident that they are robust yet simple enough to be traded by just about anyone with a desire to do so.

Mebane Faber has generated a significant buzz with his rotational models, and so for this next round I will be testing an idea that he published almost four years ago — A Simple Momentum System for Beating the Market. Rather than quoting extensively from his post, I’ll rely on the reader to click over and read it for themselves. I’ll cover the most important aspects of the system below.

The Asset Class Rotational Model:

  • uses 5 asset classes — U.S. Stocks, Foreign Stocks, Bonds, REITs, and Commodities
  • uses monthly bars to generate all calculations
  • ranks the ETFs by calculating the 3 month, 6 month, and 12 month rate-of-change, and then averaging them
  • trades the top 5 ranked ETFs with each position given an equal portfolio allocation
  • re-ranks the ETFs at the end of the month and rotates out of ETFs that have fallen below the top 5 and replaces those ETFs with the ones that have replaced them in the top 5
  • is long-only and in the market all the time UNLESS there are no asset classes with a rank above zero
  • rotates at the close of the monthly bar

The ETFs used for this test are those suggested by Faber. No commissions or slippage were included.

All charts/graphs can be enlarged with a double-click.

Results:

Equity Curve:

Green areas show the periods when the system was not fully invested and had some or all of its capital in cash.

Historical Profits:

Caveats and Thoughts:

The most significant caveat is that many of these ETFs do not have data going back to 2003. Some of them did not start trading until 2008. Therefore the impact of the entire portfolio is not seen until after 2008. Using index data (which would allow testing even farther back than 2003) instead of ETFs would allow a more accurate sampling of how each asset class affects results prior to 2008, but since indices are not tradeable, the results may still not be reliably generalized.

The starting date and ending date for the test is also important to consider. I would have liked to include the 2001-2003 bear market but the ETF data is simply not available to do so.

2011 was the worst year of the test period. Since it is well known that many hedge funds underperformed in 2011, I’m wondering if many of them were trading relative strength strategies.

Can the Strategy Be Improved?

The purpose of this post was to demonstrate the strategy outlined by Faber.

There are additional factors that can be added to increase the annualized results while decreasing the drawdown. The next post will describe and implement two new factors.

Comments »

Fidelity Funds Sector Rotational System – 2 Week Update

The system went long 3 funds on 2.1.2012. I’ve been watching how the Fidelity account tracks the closing price for the funds each evening vs. the data provided by Yahoo. So far, so good. Everything has matched up perfectly. This is crucial since Yahoo data was used to backtest this system.

The current portfolio is FSHOX (Construction and Housing), FBIOX (Biotechnology), and FSRFX (Transport). The portfolio gain totals 1.42% while SPY has a gain of 2.70% over the same time period.

The earliest date for possible rotation out of the three current funds into new ones is March 3rd.

As of today’s close, the top three Fidelity Sector funds are as follows:

  1. FBIOX (Biotechnology)
  2. FSHOX (Construction and Housing)
  3. FSCGX (Industrial Equipment)


Comments »