There are literally hundreds of research reports out there that demonstrate the ability of relative strength (momentum) strategies to beat the market. The latest one I read is here, and it is highly recommended. I plan to continue testing and development of relative strength rotational models as I feel confident that they are robust yet simple enough to be traded by just about anyone with a desire to do so.
Mebane Faber has generated a significant buzz with his rotational models, and so for this next round I will be testing an idea that he published almost four years ago — A Simple Momentum System for Beating the Market. Rather than quoting extensively from his post, I’ll rely on the reader to click over and read it for themselves. I’ll cover the most important aspects of the system below.
The Asset Class Rotational Model:
- uses 5 asset classes — U.S. Stocks, Foreign Stocks, Bonds, REITs, and Commodities
- uses monthly bars to generate all calculations
- ranks the ETFs by calculating the 3 month, 6 month, and 12 month rate-of-change, and then averaging them
- trades the top 5 ranked ETFs with each position given an equal portfolio allocation
- re-ranks the ETFs at the end of the month and rotates out of ETFs that have fallen below the top 5 and replaces those ETFs with the ones that have replaced them in the top 5
- is long-only and in the market all the time UNLESS there are no asset classes with a rank above zero
- rotates at the close of the monthly bar
The ETFs used for this test are those suggested by Faber. No commissions or slippage were included.
All charts/graphs can be enlarged with a double-click.
Results:

Equity Curve:

Green areas show the periods when the system was not fully invested and had some or all of its capital in cash.
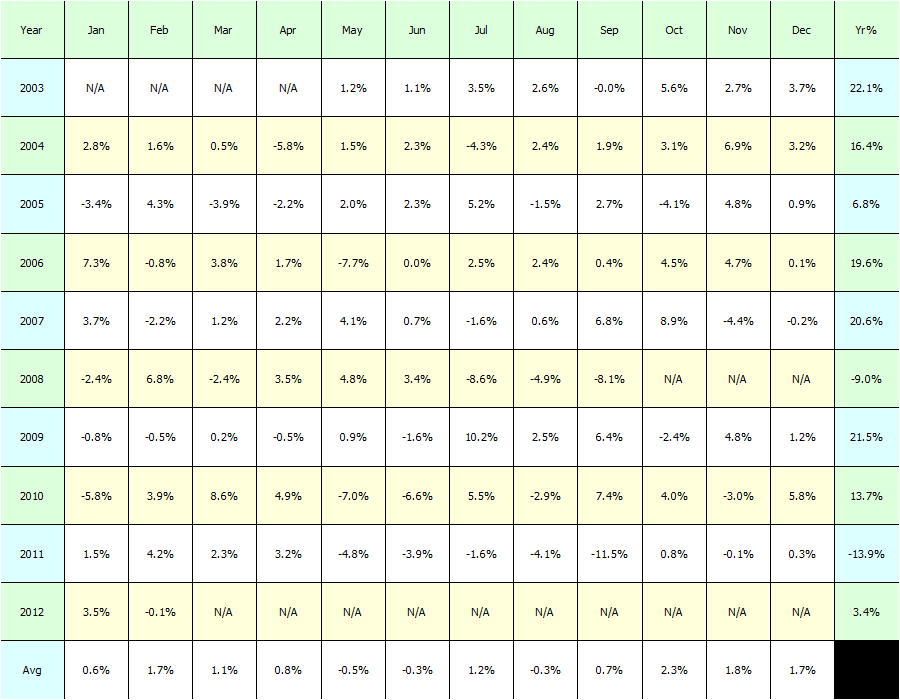
Historical Profits:
Caveats and Thoughts:
The most significant caveat is that many of these ETFs do not have data going back to 2003. Some of them did not start trading until 2008. Therefore the impact of the entire portfolio is not seen until after 2008. Using index data (which would allow testing even farther back than 2003) instead of ETFs would allow a more accurate sampling of how each asset class affects results prior to 2008, but since indices are not tradeable, the results may still not be reliably generalized.
The starting date and ending date for the test is also important to consider. I would have liked to include the 2001-2003 bear market but the ETF data is simply not available to do so.
2011 was the worst year of the test period. Since it is well known that many hedge funds underperformed in 2011, I’m wondering if many of them were trading relative strength strategies.
Can the Strategy Be Improved?
The purpose of this post was to demonstrate the strategy outlined by Faber.
There are additional factors that can be added to increase the annualized results while decreasing the drawdown. The next post will describe and implement two new factors.


What language / program do you use to build your models? I have been meaning to ask.
Hi TJ, I use AmiBroker, with a data feed from Norgate Premium Data.
My quick calculations suggest that if you just use three month ranking and buy only the top two and invest for a month, you get a much better CAGR and a sharpe ratio of .9.
There are other ways to improve upon it – for example, I added AGG to the starting portfolio of VTI, TLT, DBC, IYR and EFA, and the performance with the 3/2/1 strategy described increased to 16%.
Thanks Gregor, I’ll check that out.
Is that Gregor MacDonald?
______
Wood, there must be another momo system by Faber called “The Ivy Portfolio”
I think it performs better than this one
The Ivy Portfolio buys any of the 5 ETFs which is above its 10-month simple moving average (SMA), else its in cash.
US Stocks – VTI
Foreign Stocks – VEU
US Bonds – IEF
REITs – VNQ
Commodities – DBC
Go2, there is that one as well. I’m going to test that one when I finish this one. Thanks!
The VTI, EEM, IYT,DBC, TLT, and AGG basket yields 20% during 2003-2011 if you use 3 month ranking and invest the top two for one month.
Sorry that was IYR not IYT.
gregor, appreciate it! I’ll try to replicate your results…
Hi. This is an interesting study. In terms of the 10SMA Approach, I looked at this and from my conclusions, what i found was that it only really outperforms 2000 onwards. Before then, it broadly tracks the market. Yes the returns are smoother but from an overall perspective v buy and hold, there wasn’t any material difference pre 2000. Is this your conclusion as well or have I mis analysed? Interesting studies!!!
I’ve got a suggested name for this system, Wood.
“The Potsie System”
(subhead: “Sit on it and rotate”)
_______
A question for Wood. You said you use Amibroker for test, right? What do you think if we work for incorporate the risk free interest (which we earn when the system is totally or partially out) in Amibroker’s result?
Hi Simon, in the next post (hopefully completed tonight) I will incorporate a return on cash generated from holding $SHY or $TLT.
Thanks for running the back tests!
Thank you Wood. Can i see how to do that (incorporate return on cash) in Amibroker? Can you contact me by mail please?
Simon, I will send you an email, but for the record, both the Quanting Dutchman (google him) and Amibroker University have code for this. I recommend AmibrokerU code only because their code is simpler than the Dutchman’s. That doesn’t mean it is better.
Go to Amibrokeru.com, register (its free), navigate to “Free Library” then “Free Code” and look for the InvestCash.afl file.
Rotational trading is the latest “flavor of the month”. Before it, the fashion was countertrending, until it died about 2010.
And before that was momemtum stocks buy in the dips, until 2000 . . . and so on and so for.
Backtests are always impresive, like this one ( which is particularly well executed ).
They just ignore the fact that after they are published, the observed outperformance will disappear in a matter of weeks. The reason ? Precisely because they were published and everybody is doing similar tets, finding the same results and rushing to place the trades, only to see them loose money ( front running, anyone ?)
Again, congratulations on a backtest done with scientific rigor. One of the very few published.
eb
Thanks eber. While rotational trading may be the flavor of the month, the edge derived is not from the rotating. How the system is implemented has an affect, but not a significant one, on performance.
Instead, it is the momentum, or the relative-strength used to rank the ETFs, stocks, whatever, that drives performance. This edge as been known for over 100 years, and yet it still persists. Even after hundreds of research papers on relative strength and momentum, it still persists.
So while it could quit working soon, I am doubtful that it will because it has been so well known for so long. If knowledge of the edge is enough to make it end, then this edge should have ended back in the 1950s when the first books were being published about it.
If you still disagree, please come back and write more. I would enjoy hearing your opinion on this.
Woodshedder: we are not really disagreeing, just looking at the carrot from the two different ends.
Agreed, momentum has to be the longest surviving market “anomaly”. My guess is that because it has always been applied to stocks, and trading these rockets is very tough on the stomach, that plus the occasional brutal crashes. After a while, individual investors get sick and quit. Institutionals rarely can do much with the typically small caps that shine in momentum.
On the other hand, asset rotation trading simply was not feasible until the coming of ETFs. Call it about 15 years for the most. And it is quite clear that rotation has been very nice when backtested in the last 10 years or so. Then, popularity. Coming next, excessive popularity.
When I say popularity I mean the system of rotating ETFs, not momentum itself.
Keep the interesting work.
You know, this site is always the first one I check every morning.
Best
eber
Could you substitute commission-free ETFs from Fidelity for the set that was originally used? Do suitable substitutes exist?
Woodshedder, I’m currently having the same dilemma on how to solve the gaps between missing data between actively traded ETFs. Take for example GLD – started in ’04! less than 2000 days of data :-/ shoots up the data mining bias a lot for the lack of data. I was thinking of creating artificial data based on spot indexes and a correction of some kind to “adjust” for the ETF’s fees/liquidity/etc… what do you think? I know it sounds really non-kosher but I rather have more imperfect data than less real data and more data mining bias chipping away expected returns.
cheers,
leo
Leo, its a serious problem, no doubt. I like your idea of creating artificial data. Perhaps an idea would be to use the index data until the ETF data begins, and then stop the index data? I don’t know.
It could be that artificial data is worse than index data.
Makes it interesting, no? 🙂
I took a ratio of continuous gold contract and GLD, a 50D Hull MA of that average and a Spearman Correlation Coefficient of the two.
I divided the continuous gold fut by the 50DHMA of the ratio.
http://news.webshots.com/photo/2196010070107085023Iclwds
Bottom line: the earlier into the life of the ETF data the bigger and uglier the discrepancies get between the two.
I think it’s best to just stick with what you said and place the index before the first trading day but I’d also add some kind of flat reduction to performance from each trade according to the annualized stdev of total 252D ROC of total average of the ratio. In this case it’s 0.079%.
cheers