There is a breadth measure that I’ve been keeping an eye on. It is simply a count of the number of stocks that are up and down 25% or more in a quarter. Here is a good primer on this breadth measure: How to Use Market Breadth to Avoid Market Crashes.
Let’s take a long-term look at how this particular breadth measure has performed (click to enlarge):
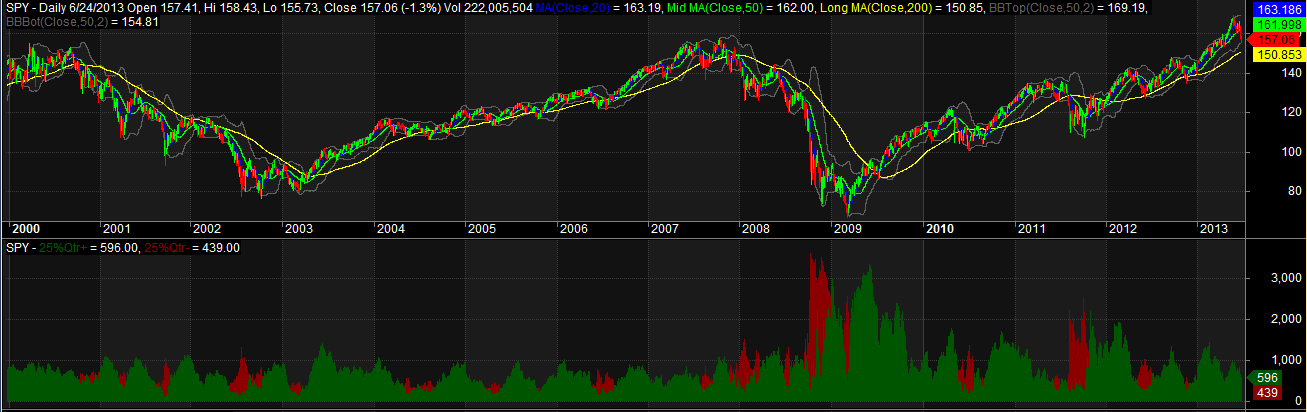
The red is the number of stocks down 25% or more in a quarter (65 days) and the green is the number of stocks up 25% or more in a quarter. What is obvious is that every crash or bear market was preceded by the red measure growing and the green measure shrinking.
I like this indicator, and I think it will work, but I’m not quite sure how to use it, yet. I need to do some backtesting and figure out what it looks like to be in cash when there are fewer stocks up 25% or more in a quarter then the number of stocks down 25% or more in a quarter. Also, most times that the red is higher than the green, nothing major happens, and the market resumes the uptrend. Does this indicator give any clues that something more than a normal correction is ahead? I don’t know, but I’m going to poke at it a little bit and see what happens.
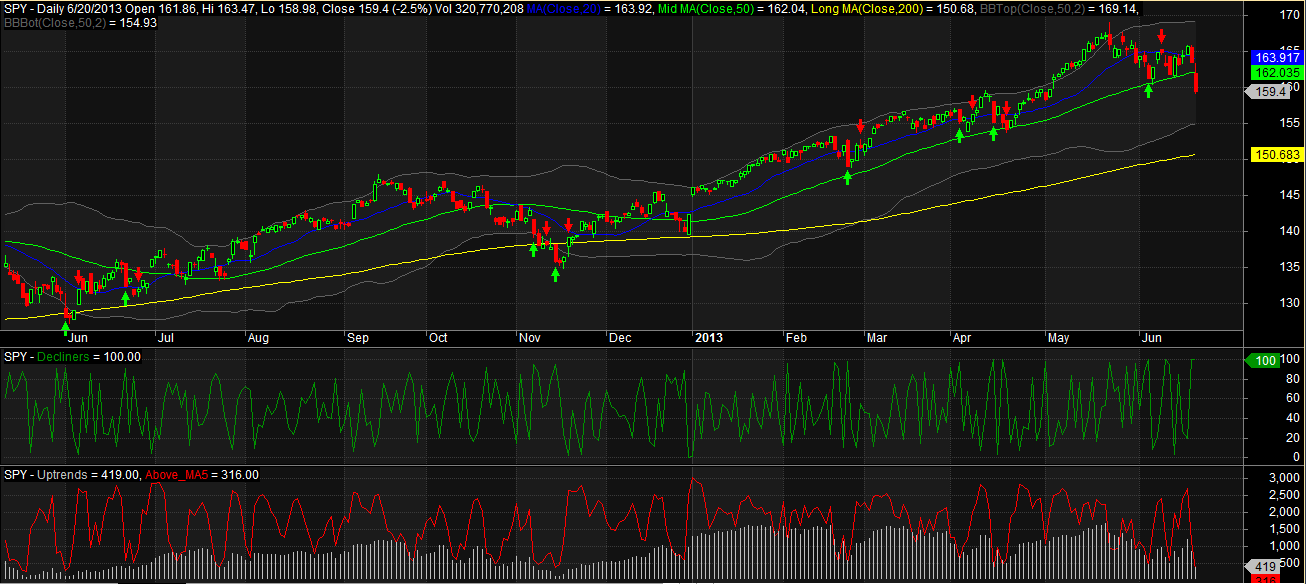
The good news is that the current reading shows that there are 596 stocks up 25% or more and only 439 stocks down 25% or more. This lends weight to my current stance that we are just experiencing a normal market correction.
Comments »