There is a breadth measure that I’ve been keeping an eye on. It is simply a count of the number of stocks that are up and down 25% or more in a quarter. Here is a good primer on this breadth measure: How to Use Market Breadth to Avoid Market Crashes.
Let’s take a long-term look at how this particular breadth measure has performed (click to enlarge):
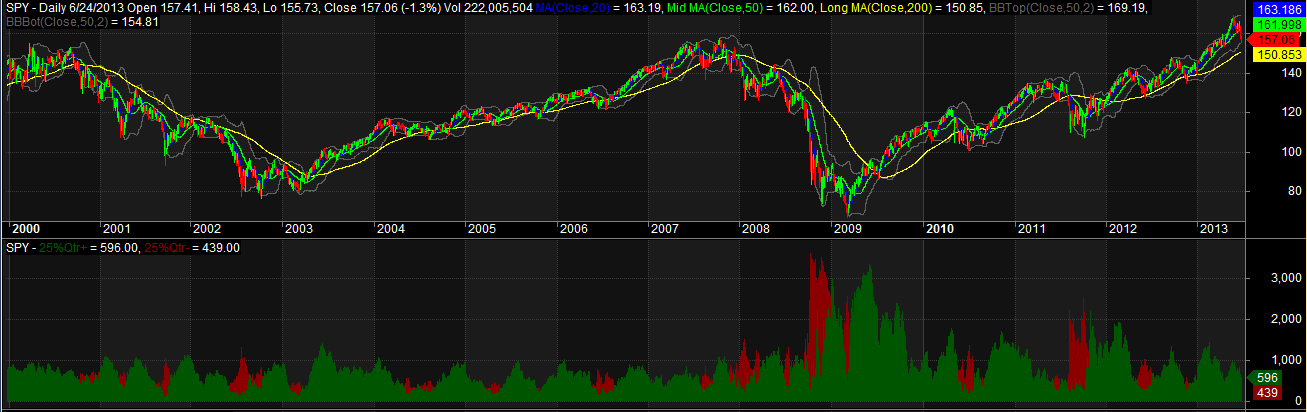
The red is the number of stocks down 25% or more in a quarter (65 days) and the green is the number of stocks up 25% or more in a quarter. What is obvious is that every crash or bear market was preceded by the red measure growing and the green measure shrinking.
I like this indicator, and I think it will work, but I’m not quite sure how to use it, yet. I need to do some backtesting and figure out what it looks like to be in cash when there are fewer stocks up 25% or more in a quarter then the number of stocks down 25% or more in a quarter. Also, most times that the red is higher than the green, nothing major happens, and the market resumes the uptrend. Does this indicator give any clues that something more than a normal correction is ahead? I don’t know, but I’m going to poke at it a little bit and see what happens.
The good news is that the current reading shows that there are 596 stocks up 25% or more and only 439 stocks down 25% or more. This lends weight to my current stance that we are just experiencing a normal market correction.


This is a pretty interesting and original indicator, and given a choice I’ll take more green than red even if it’s not a sure thing. I had forgotten about Stockbee – that’s what happens when there are so many good financial sites to follow.
On the other hand, I’ve tried to incorporate indicators like this into a couple of trading systems (trying to reduce drawdowns) and not had much luck. They clearly pick up times when the market is weak and falling, but the ones I was playing with also gave many false signals. In the end they detracted from the various systems’ intrinsic performance. Maybe the answer is to tolerate the performance hit in exchange for being on the sidelines when the market really takes a tumble?
Wood, if you can come up with some improvements, that might give this indicator an edge.
Yeah, it is really hard to reduce drawdowns in good systems. You hit the nail on the head. Either you take the hit to system performance numerous times but know that eventually it will save you a 20+% drawdown, or you accept superior performance knowing that eventually you’ll get caught in a big drawdown.
I’m sure each situation is good for some trader’s psychology but won’t work for others. It really depends on personal preference and risk tolerance.
I’ll be writing more about this one in the future.
I forgot to mention that what seems to work the best in adding “overlays” onto another system is to use something totally unrelated to the original system. So, if I was already using a breadth based system, adding this indicator probably won’t help too much, but since I do a lot of value investing, this might be a good way to avoid value traps (stocks that look cheap but go bankrupt when their debt can’t be refinanced as the market drops even more). Just a thought….
Did you see the weekend read about value and momo?
Yes, it’s on my reading list – number 23 in line, right behind a bunch of stuff on SSRN from CXO Advisory. But in truth value has not worked very well for me for several years now. Perhaps the retail investor needs to come back in for it to work again?
Question(s): what are you using for the universe of stocks when calculating this?
And then, when looking back for historical purposes … does your database contain de-listed stocks also? (ie free of survivorship bias?) Do you think that makes a big difference?
Hi BB,
I am using all major exchange listed stocks where their 20 day average price multiplied by their 20 day average volume is greater than or equal to $250,000
(MA20*AV20)>=250000
I have delisted data but do not include it in this scan. I do think it makes large difference in many tests but I’ve not seen it make a large difference in this particular scan. I don’t think Pradeep uses delisted data. In my attempts to replicate his studies, I did not use it either.
I use Common Stock list from Telechart. Common Stock eliminates the ETF and Indexes which show up in All Stock list.
I have seen people doing tests on data using desisted stocks using Norgate data, it shows same thing. Extreme positive or negative breadth is mean reverting.
Like most breadth indicator it works best for finding extremes. Extremely bullish breadth numbers tend to be bearish. When less than 3% of stocks are down 25% it is bearish and when less than 3% of stocks are up 25% it is bullish.
Crossover in breadth does not signal much because at that point the market would be in correction mode from much higher breadth level.
The indicator works best near bottom and tops are difficult to spot. Which is true of most breadth indicators.
Thanks for your comments! I love your blog. Highly recommended reading…