In several recent posts I discussed how I use a couple of breadth indicators. The last post, Now I’m Looking for a Tradeable Bounce, was spot on:
The good news is that both indicators are now aligned which means I feel comfortable looking for a tradeable bounce. This means I expect a bounce that will last 3 to 5 days.
So the bounce lasted 3 days and we have fallen for 2 days. The indicators are again pointing to a tradeable bounce. But will we get the bounce again?
The short, honest answer is I don’t know.
There are examples of the indicators working over and over again in rapid succession. See September and October of 2012 in the chart below. However, when the market is correcting, eventually a lower low will occur. I believe the market is in a corrective phase, so it makes sense to me to expect lower lows. Will they come after another tradeable bounce?
A couple of factors worth considering: The 50 day average will act as an area of support, and the expectation is NOT for the economy (or the market) to completely fall apart. Those of you who remember well what it was like to trade from 2007 – 2009 should note that we are not staring down an Armageddon. Instead, the odds are that we are simply having to shrug off a garden-variety market correction. If you didn’t trade during the Great Recession, then you should be accepting that market corrections are just part of the game.
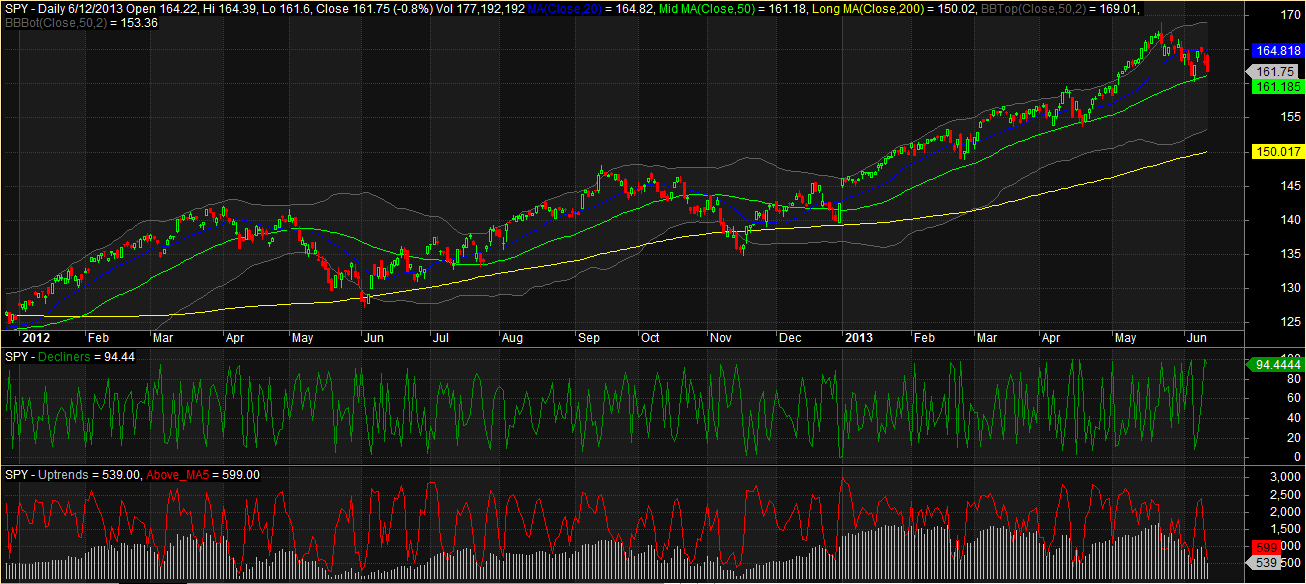
We are focused on the green “decline line” indicator and the red “number of stocks above their 5 day moving average” indicator. Both are aligned at levels that typically indicate an imminent bounce that may last 3 – 5 days.
My best guess is that we see some stabilization around the 50 day average. I would not be surprised by another quick and small bounce. But ultimately I am expecting $SPY to trade beneath the 50 day average, within a week.


Interesting thoughts. My intuition says we get a weak bounce that is quickly reversed, similar to your guess.
I wanted to look at this backwards – can we infer the market environment by seeing what these bounces are doing? I kind of duplicated your analysis over the past decade and it seems like “positive” and “negative” bounces (a negative bounce is a loss after 3 to 5 days) occur close together when the market is correcting heavily; when the market is correcting mildly we get fewer bounces but more of them are positive. If the trigger conditions start happening every couple of days I would probably be betting on significant declines ahead.
I agree and couldn’t have said it better!
Great post and comments, guys! Thank you!
that indicator is pretty fantastic – was it built in amibroker??
Thanks. Yes it was. It is relatively simple to code.
I’m curious how it would work on an interday basis – have you looked into that?
I don’t have access to intraday data.