In case you hadn’t noticed, there is a new sheriff in town, and his name is DV2. The DV2 is a new indicator developed by David Varadi of CSS Analytics blog fame. For the best overview of how this indicator works, including how to calculate it, see this series of posts.
While there has been a great deal already written about this indicator (geeks are easily excited by such things as new formulas), one aspect that has been mentioned but not yet reviewed in the quant blogosphere is that a divergence between DV2 and RSI2 may allow forecasting of future returns.
The Method:
Entry: Go long the SPY if the difference yesterday between RSI2 and DV2 < 5 and the difference today > 5.
Exit: An n day exit (geek speak for a time based exit) will be used.
All trades are opened and closed at the close, and no commissions were used. While I prefer testing opening and closing trades on the open, my rate-of-change calculations were already set up using the closing prices.
The Results:
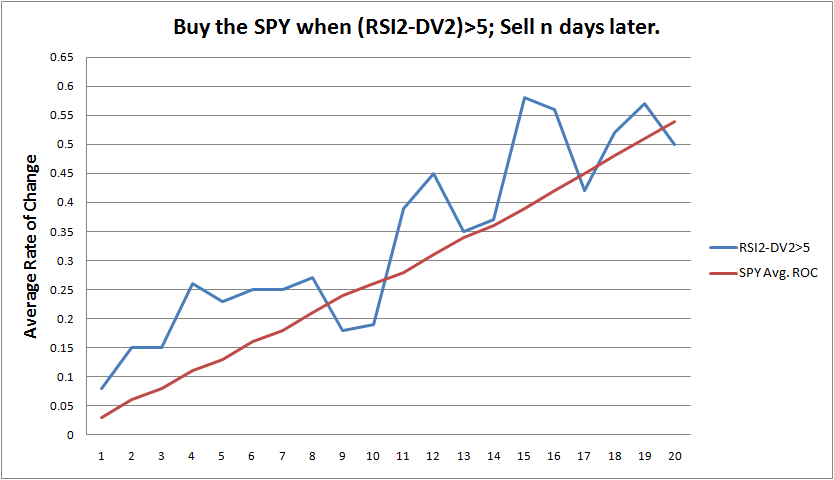
The blue line illustrates the average daily change after buying the SPY when the difference between RSI2 and DV2 is greater than 5. The red line is the average daily rate-of-change of the SPY, calculated using all of its history.
The graph demonstrates that there is an edge. In terms of efficiency (profits per day) it appears that the edge is strongest over the next 4 days following the divergence.
Summary:
The results show that there can be situations where RSI2 has risen to extreme heights without confirmation from DV2. Traditionally, a high RSI2 would have signaled to sell a long position or go short. The addition of DV2 can help traders judge when the market might have room for additional upside, despite an extreme RSI2 reading. This phenomenon is best illustrated by looking at a chart of the two indicators with the SPY (below).
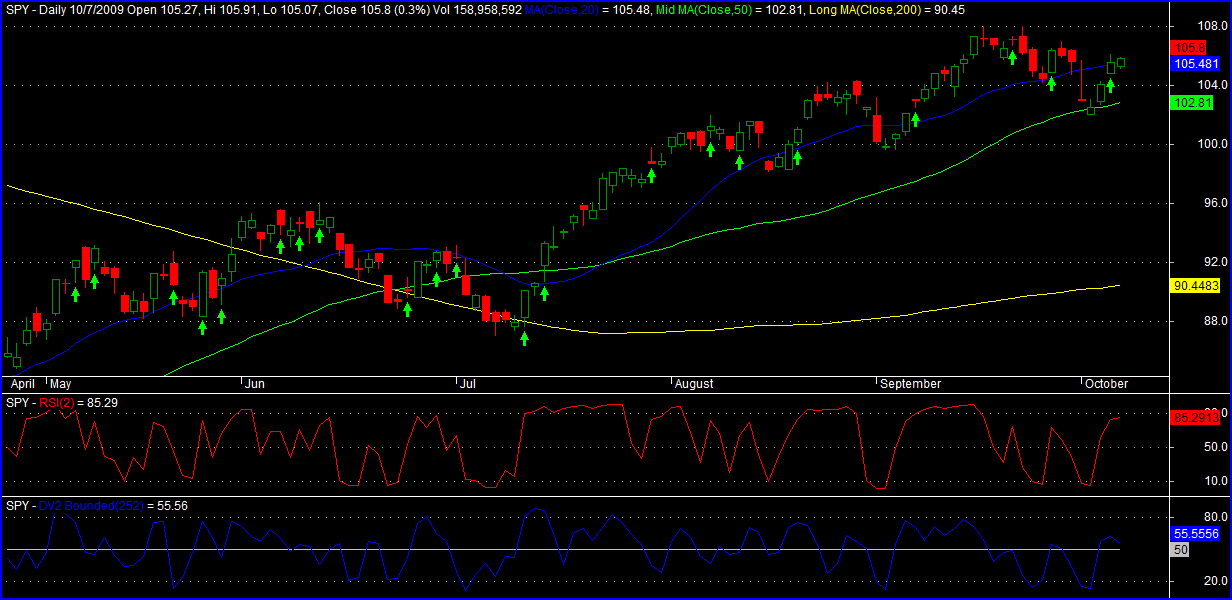
The green arrows show all raw entry possibilities. There were many times over the past several months were DV2 did not confirm RSI2, and a divergence developed. The divergence can alert traders to the possibility of more upside.
Further Research:
In the future I will examine what happens when the opposite divergence occurs (DV2 is higher than RSI2). Also, an extreme divergence where (RSI2-DV2)>50 will be examined to determine any implications for forecasting future returns.
Should anyone find the DV2 to be a valuable addition to his toolbox, Mr. Varadi will be releasing the DV2 along with a whole suite of indicators, including a super-charged DV2, in the very near future. Be sure to visit his blog for more information.
Comments »
