On the open, the system will purchase Valley National Bancorp [[VLY]] .
The system is long Genesco Inc. [[GCO]] and The Kroger Co. [[KR]] .
Have a great day!
Comments »On the open, the system will purchase Valley National Bancorp [[VLY]] .
The system is long Genesco Inc. [[GCO]] and The Kroger Co. [[KR]] .
Have a great day!
Comments »NOVEMBER 1, 2009, 11:23 P.M. ET
Speaker Nancy Pelosi has reportedly told fellow Democrats that she’s prepared to lose seats in 2010 if that’s what it takes to pass ObamaCare, and little wonder. The health bill she unwrapped last Thursday, which President Obama hailed as a “critical milestone,” may well be the worst piece of post-New Deal legislation ever introduced.
In a rational political world, this 1,990-page runaway train would have been derailed months ago. With spending and debt already at record peacetime levels, the bill creates a new and probably unrepealable middle-class entitlement that is designed to expand over time. Taxes will need to rise precipitously, even as ObamaCare so dramatically expands government control of health care that eventually all medicine will be rationed via politics.
Yet at this point, Democrats have dumped any pretense of genuine bipartisan “reform” and moved into the realm of pure power politics as they race against the unpopularity of their own agenda. The goal is to ram through whatever income-redistribution scheme they can claim to be “universal coverage.” The result will be destructive on every level—for the health-care system, for the country’s fiscal condition, and ultimately for American freedom and prosperity.
•The spending surge. The Congressional Budget Office figures the House program will cost $1.055 trillion over a decade, which while far above the $829 billion net cost that Mrs. Pelosi fed to credulous reporters is still a low-ball estimate. Most of the money goes into government-run “exchanges” where people earning between 150% and 400% of the poverty level—that is, up to about $96,000 for a family of four in 2016—could buy coverage at heavily subsidized rates, tied to income. The government would pay for 93% of insurance costs for a family making $42,000, 72% for another making $78,000, and so forth.
At least at first, these benefits would be offered only to those whose employers don’t provide insurance or work for small businesses with 100 or fewer workers. The taxpayer costs would be far higher if not for this “firewall”—which is sure to cave in when people see the deal their neighbors are getting on “free” health care. Mrs. Pelosi knows this, like everyone else in Washington.
Even so, the House disguises hundreds of billions of dollars in additional costs with budget gimmicks. It “pays for” about six years of program with a decade of revenue, with the heaviest costs concentrated in the second five years. The House also pretends Medicare payments to doctors will be cut by 21.5% next year and deeper after that, “saving” about $250 billion. ObamaCare will be lucky to cost under $2 trillion over 10 years; it will grow more after that.
• Expanding Medicaid, gutting private Medicare. All this is particularly reckless given the unfunded liabilities of Medicare—now north of $37 trillion over 75 years. Mrs. Pelosi wants to steal $426 billion from future Medicare spending to “pay for” universal coverage. While Medicare’s price controls on doctors and hospitals are certain to be tightened, the only cut that is a sure thing in practice is gutting Medicare Advantage to the tune of $170 billion. Democrats loathe this program because it gives one of out five seniors private insurance options.
As for Medicaid, the House will expand eligibility to everyone below 150% of the poverty level, meaning that some 15 million new people will be added to the rolls as private insurance gets crowded out at a cost of $425 billion. A decade from now more than a quarter of the population will be on a program originally intended for poor women, children and the disabled.
Even though the House will assume 91% of the “matching rate” for this joint state-federal program—up from today’s 57%—governors would still be forced to take on $34 billion in new burdens when budgets from Albany to Sacramento are in fiscal collapse. Washington’s budget will collapse too, if anything like the House bill passes.
• European levels of taxation. All told, the House favors $572 billion in new taxes, mostly by imposing a 5.4-percentage-point “surcharge” on joint filers earning over $1 million, $500,000 for singles. This tax will raise the top marginal rate to 45% in 2011 from 39.6% when the Bush tax cuts expire—not counting state income taxes and the phase-out of certain deductions and exemptions. The burden will mostly fall on the small businesses that have organized as Subchapter S or limited liability corporations, since the truly wealthy won’t have any difficulty sheltering their incomes.
This surtax could hit ever more earners because, like the alternative minimum tax, it isn’t indexed for inflation. Yet it still won’t be nearly enough. Even if Congress had confiscated 100% of the taxable income of people earning over $500,000 in the boom year of 2006, it would have only raised $1.3 trillion. When Democrats end up soaking the middle class, perhaps via the European-style value-added tax that Mrs. Pelosi has endorsed, they’ll claim the deficits that they created made them do it.
Under another new tax, businesses would have to surrender 8% of their payroll to government if they don’t offer insurance or pay at least 72.5% of their workers’ premiums, which eat into wages. Such “play or pay” taxes always become “pay or pay” and will rise over time, with severe consequences for hiring, job creation and ultimately growth. While the U.S. already has one of the highest corporate income tax rates in the world, Democrats are on the way to creating a high structural unemployment rate, much as Europe has done by expanding its welfare states.
Meanwhile, a tax equal to 2.5% of adjusted gross income will also be imposed on some 18 million people who CBO expects still won’t buy insurance in 2019. Democrats could make this penalty even higher, but that is politically unacceptable, or they could make the subsidies even higher, but that would expose the (already ludicrous) illusion that ObamaCare will reduce the deficit.
• The insurance takeover. A new “health choices commissioner” will decide what counts as “essential benefits,” which all insurers will have to offer as first-dollar coverage. Private insurers will also be told how much they are allowed to charge even as they will have to offer coverage at virtually the same price to anyone who applies, regardless of health status or medical history.
The cost of insurance, naturally, will skyrocket. The insurer WellPoint estimates based on its own market data that some premiums in the individual market will triple under these new burdens. The same is likely to prove true for the employer-sponsored plans that provide private coverage to about 177 million people today. Over time, the new mandates will apply to all contracts, including for the large businesses currently given a safe harbor from bureaucratic tampering under a 1974 law called Erisa.
The political incentive will always be for government to expand benefits and reduce cost-sharing, trampling any chance of giving individuals financial incentives to economize on care. Essentially, all insurers will become government contractors, in the business of fulfilling political demands: There will be no such thing as “private” health insurance.
All of this is intentional, even if it isn’t explicitly acknowledged. The overriding liberal ambition is to finish the work began decades ago as the Great Society of converting health care into a government responsibility. Mr. Obama’s own Medicare actuaries estimate that the federal share of U.S. health dollars will quickly climb beyond 60% from 46% today. One reason Mrs. Pelosi has fought so ferociously against her own Blue Dog colleagues to include at least a scaled-back “public option” entitlement program is so that the architecture is in place for future Congresses to expand this share even further.
As Congress’s balance sheet drowns in trillions of dollars in new obligations, the political system will have no choice but to start making cost-minded decisions about which treatments patients are allowed to receive. Democrats can’t regulate their way out of the reality that we live in a world of finite resources and infinite wants. Once health care is nationalized, or mostly nationalized, medical rationing is inevitable—especially for the innovative high-cost technologies and drugs that are the future of medicine.
Mr. Obama rode into office on a wave of “change,” but we doubt most voters realized that the change Democrats had in mind was making health care even more expensive and rigid than the status quo. Critics will say we are exaggerating, but we believe it is no stretch to say that Mrs. Pelosi’s handiwork ranks with the Smoot-Hawley tariff and FDR’s National Industrial Recovery Act as among the worst bills Congress has ever seriously contemplated.
From the WSJ Online.
Comments »Let me be clear. I think the market is rolling over, and will continue rolling over, until it stops rolling over. When it might stop is too hard to accurately forecast at this point, but if I were forced to guess, I’d look for support near 96 on the SPY, or about 8% lower from today’s close.
Thus, I want some short exposure. Unfortunately, consistently out-performing short-only systems are very hard to come by, and so I’m left with having not enough short exposure, or I will have to make a few discretionary trades.
I’m opting for a few discretionary shorts.
My current favorite is [[IYR]] .
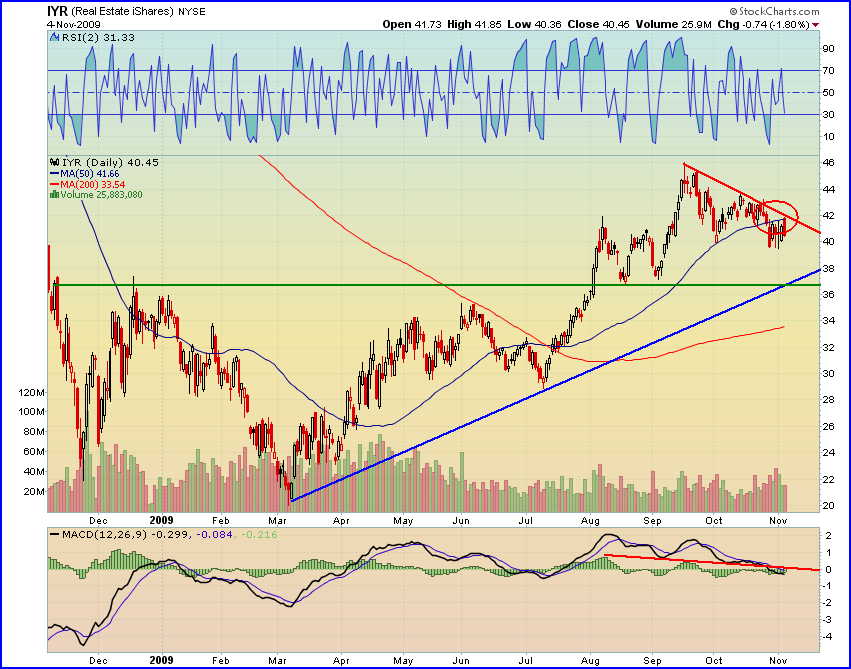
I like that IYR has been denied 3 times at the 50 day average and the declining downtrend line.
A stop above 42 and a profit target near 37 gives a risk/reward ratio of 2:3.
Here are the top holdings of IYR. If you look at the constituent charts, you’ll note that most of them are juicy as well.
Comments »Finally, we get a sell signal.
Concho Resources Inc. [[CXO]] will be sold on the open.
On Tuesday, Cheniere Energy Partners, L.P. [[CQP]] stopped out. After selling CXO, the system will be left holding Genesco Inc. [[GCO]] and The Kroger Co. [[KR]] .
There are no entry signals for today.
Comments »Perhaps one of the most difficult decisions faced by discretionary and system traders is how to allocate capital effectively to get the most bang for the buck. In other words, how do we choose which stocks to trade? Of course most traders will have a method (could be technical or fundamental) they use to screen for eligible candidates, but invariably the number of candidates will exceed what can be managed with available time and capital. I can remember spending many many hours in the evenings pouring over charts, looking at setups, and trying to decide which setup was better than another.
All other elements of a setup being equal, the final arbiter of stock selection should be volatility. Volatility will determine whether one stock is likely to move farther/faster than another over a given period of time. This is bang for the buck.
There are many ways to measure or calculate volatility, some more complicated than others. The most commonly used measures are Average True Range, Rate-of-Change, and Volatility.
Lets go back to our hypothetical trader with 20 eligible setups, but only enough capital available for 5 positions. The 20 setups should be ranked based on their volatility, and the 5 most volatile stocks should be selected. These stocks will be more likely to produce larger gains (or losses) than their brethren.
This one simple addition to a trader’s toolbox will save time through simplification of the selection process, and assuming one is in possession of a positive expectancy strategy, will increase returns.
Comments »Included below is the spreadsheet with October’s trades. Note the carnage.
Out of a universe of 2,376 stocks, there are currently 183 eligible stocks, which means if any of the 183 gave an entry signal, they would be ranked and added to the Power Dip portfolio.
Two weeks ago, there were 1,343 eligible stocks, out of a universe of 2184.
If the market continues to weaken, the Power Dip may very well turn itself off. The system has already begun and may continue to curtail the amount of trades it makes.
On Friday, Forest Oil Corporation [[FST]] and [[DENN]] both were stopped out. The system is long 4 positions.
On Monday’s open, the system will be purchasing The Kroger Co. [[KR]] ]. It is the only pick for Monday (see info above about the system curtailing its trades).
Comments »Perhaps the most difficult part of mechanical system trading is being disciplined and continuing to trade the system through good times and bad. At times, there can be significant doubt in the mind of the trader, and the urge to quit the system can be overwhelming. However, at some point, the system may indeed be broken, and in need of repair or trashing. How might one know when the system is experiencing a normal period of poor performance versus actually breaking down? Being able to answer this type of question will go a long way towards ensuring the mechanical trader can stick with the system through hard times and adjust or quit trading it when something is out of whack.
I will of course be using the Power Dip system as an example, primarily because I have a great deal of backtested historical data as well as 6 months of real-time trade data. These types of control charts will be available, updated monthly, for subscribers to the Power Dip system.
Data generated from backtesting is not the same as data created from trading a system in real-time. Perhaps the most significant difference for a system like the Power Dip is going to be with slippage. There are other differences as well, primarily concerning the fact that historical backtested data will rarely match real-time data, trade for trade. Usually the sequence of symbols will not match. This might be an issue for some systems without a lot of trades, but with over 4500 historical trades generated, and over 150 real-time trades, I feel strongly that the Law of Large Numbers will take care of the discrepancies. What I mean by this is that over enough trades, it should not matter that the historical sequence of trades does not match exactly the real-time sequence. Regardless, it is something to keep in mind when comparing historical backtested data to real-time.

The most important feature of the above chart is the large spike down in the 20TradeAverage, which occurs in March of 2000. Note that the 20TradeAverage approached -8% before recovering.

In the above chart, on the right-most side, is another spike down in the 20TradeAverage, which is approaching -8%.
What can be gleaned from these graphs? The system has experienced a previous period of under-performance similar to what it is experiencing currently. The exact date of the lowest point in the 20TradeAverage was March 17, 2000. What did the market look like in March, 2000, and are there any similarities to the current market?
Lets look at some charts of the Russell 2K index during that time.

First, a zoomed-out view of the Russell 2K from October 1998 to October 2000.
Here we see a market that has climbed ~50% in approximately 16 months. There have been some consolidations and pullbacks along the way, but the last 6 months of the rally, which saw gains of greater than 30%, was parabolic with only a few short and shallow retracements.
Now lets zoom in on this chart.

Above is a closeup of the Russell 2K from October, 1999, to June of 2000.
In the chart above, I’ve drawn a blue arrow pointing to March, 17th, which is the exact day of the low -8% reading on the control chart.
What we see in March of 2000 is a market that has experienced a tremendous rise, with very few pullbacks, in a relatively short amount of time. Our current market has risen even farther in percentage terms, and over a shorter time frame. Hence, I am not surprised that these two market environments, while 9 years apart, both look the same in terms of how they affect the system performance.
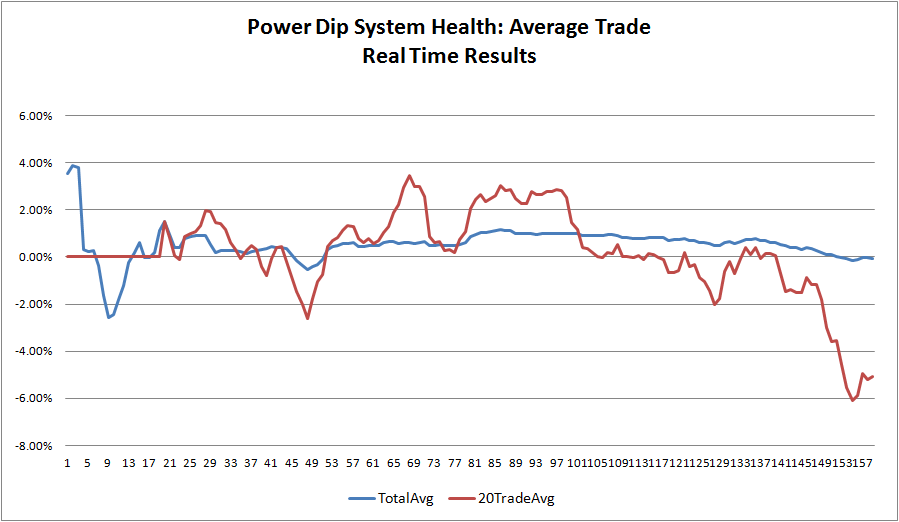
There are two important things to note about the above chart of the real-time trades.
First, as I noted earlier, these trades do not exactly match the historical backtested trades.
Secondly, (and of significant importance to me as I consider whether the system is still healthy, but just under-performing, or whether the system is breaking down) the real-time results are actually better than the backtested historical results covering the same period. The real-time results show the 20Trade Average dipping to -6%, which is better than the almost -8% shown by the historical results.
Therefore, the system appears to be healthy, but is having trouble in the current market, due primarily to the huge rise over a short period of time.
As of Friday evening, there were only 183 stocks eligible to be selected for the Power Dip out of a total universe of 2,376 stocks. To understand how drastically this ratio has changed, on 9/22, there were 1,551 stocks eligible. Basically, the number of eligible stocks has fallen very quickly as the market rolls over. This information is very important, as no one wants to trade a system into Armageddon. If the market continues to roll over, the Power Dip will simply run out of eligible stocks, and will quit making trades, or it will significantly curtail trading until the environment improves.
System traders (and discretionary traders as well) must have a method for looking under the hood of their system/performance. What I have demonstrated is very simple, but it works.
The most important function of such analysis is that it lends confidence to the mechanical trader, ensuring that he doesn’t quit trading the system at the exact worst time.
The secondary function is to ensure the mechanical trader monitors the system’s performance for signs of breaking down. My experience is that systems do not break down all of a sudden. A breakdown generally happens over many months or even years. Using these types of monitoring techniques should give ample warning of when to be cautious about continuing to trade a system that is under-performing.
Comments »
