1. Geopolitical Events. On Monday Federal Reserve Dallas President Rob Kaplan speaks at 1:30 p.m. EDT, and Minneapolis President Neel Kashkari speaks with no specific time. He gives the opening remarks at the “Too Big To Fail” Conference. Also on Monday OPEC holds an informal meeting in Algiers that lasts several days, and on Monday night the first Presidential Debate takes place. On Tuesday Federal Reserve Vice Chairman Stanley Fisher speaks at 11:15 a.m. EDT, and Federal Reserve Chicago President Charles Evans speaks at 1:30 p.m. EDT. On Wednesday Federal Reserve Chairman Yellen testifies before the House on bank supervision and financial market rules. Also on Wednesday Federal Reserve Regional Presidents Kashkari (8:45 a.m. EDT) Bullard (10:00 a.m. EDT), Mester (4:35 p.m. EDT) and George (7:15 p.m. EDT) speak. On Thursday Federal Reserve Atlanta President Lockhart speaks at 8:50 a.m. EDT, followed by Federal Reserve Chairman Yellen and then Federal Reserve Kansas City President Esther George at 4:15 p.m. EDT. The week concludes with the Congress having a deadline to pass a stopgap spending bill.
2. Economic Releases. Releases of note this week include the weekly chain store sales, oil/gas numbers, mortgage applications and new home sales, consumer confidence, durable goods, Q2 GDP, personal income, Chicago PMI and Michigan Sentiment.
3. Earnings Releases. Notable releases include CCL MTN NKE CTAS PAYX BBRY PEP CAN COST MKC.
Monday, September 26:
-
European Central Bank President Mario Draghi speaks to the European Parliament.
-
August New Home Sales are due out at 10:00 a.m. EDT and are expected to fall to 595,000 from 654,000.
-
OPEC holds an informal meeting in Algiers that runs through Wednesday.
-
The first Presidential Debate between Hillary Clinton and Donald Trump takes places at 9:00 p.m. EDT.
-
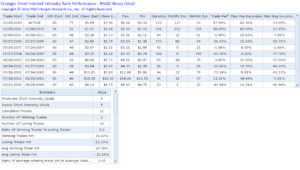
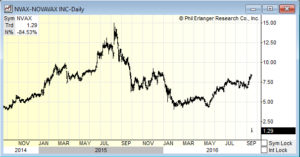
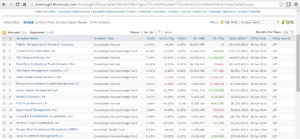
The latest NYSE and NASDAQ Short Interest is due out after the close and was compiled through September 15th settlement.
-
The Bank of Japan (BOJ) releases its latest minutes.
Tuesday, September 27:
-
September Consumer Confidence is due out at 10:00 a.m. EDT and is expected to fall to 98.8 from 101.10.
-
Federal Reserve Vice Chairman Stanley Fisher speaks at 11:15 a.m. EDT.
Wednesday, September 28:
-
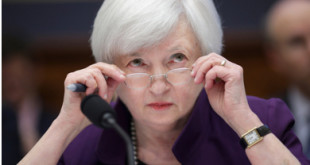
Federal Reserve Chairman Yellen testifies before the House on bank supervision and financial market rules.
-
August Durable Goods are due out at 8:30 am. EDT and are expected to fall 10 -1/9% from 4.4%.
Thursday, September 29:
-
Wells Fargo (WFC) CEO John Stumpf appears before the House Banking Committee to answer questions about the bank’s account scandal.
-
Q2 GDP (final) is due out at 8:30 a.m. EDT and is expected to rise to 1.2% from 1.1%.
-
Federal Reserve Chairman Janet Yellen speaks at 4:00 p.m. EDT.
Friday, September 30:
-
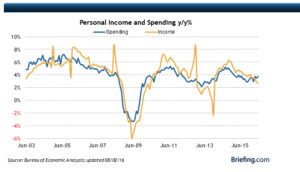
August Personal Income is due out and expected fall to 0.2% from 0.4%.
-
September Chicago PMI is due out at 9:45 a.m. EDT and is expected to rise to 52 from 51.5.
-
September Michigan Sentiment is due out at 10:00 a.m. EDT and is expected to rise to 90 from 89.8.
-
Congress faces a deadline to pass a stopgap spending bill before October 1st.