iBankCoin
Home / chessNwine (page 109)

chessNwine

Full-time stock trader. Follow me here and on 12631

Back Up the Stairs

rqb5xza

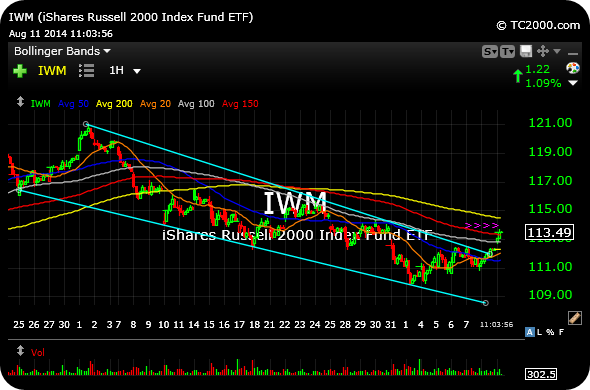
The small cap ETF for the Russell 2000 Index shows a a clear downtrend since July which has now been breached.

To say the Russell is now going to V-shape to new highs is to assume the same bull market playbook is intact. But we do know that downside momentum abated late-last week, and a snapback rally is underway.

I am looking at the $115 area above as a spot where sellers will try to come in again. Above there, and and we could see panic buying ensue.

Elsewhere, NFLX PCLN TSLA are leading the leaders, while FB is still trying to get going over $74.

It is not all peachy for bulls, though, as names like GOGO P look particularly vulnerable here.

_____________________________________________________________________

IWM


Comments »

Miners Seeing the Light

bLA4eh

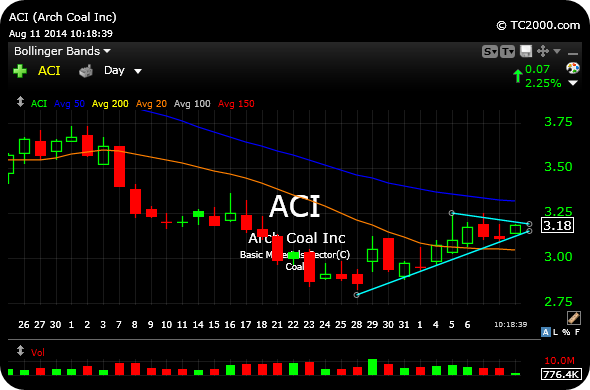
Coal miners like ANR WLT are having a good morning, while ACI sets up behind. On the first chart, below, watch for a break over $3.25 to see if it follows suit. These are still beaten-down plays but worth watching for bounce-backs.

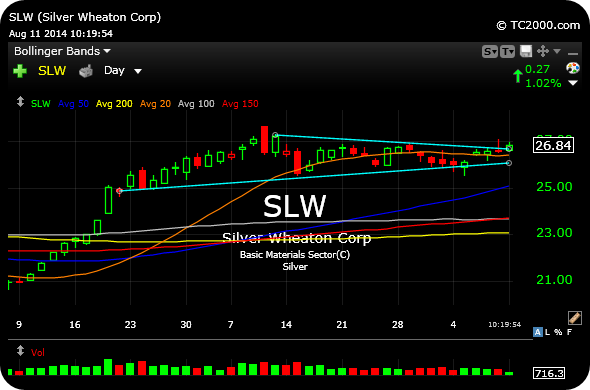
Also keep an eye on silver miners outperforming gold miners today. Silver Wheaton has an impressive daily chart technical base, with a $27 trigger.

______________________________________________________

ACI

______________________________________________________

SLW

Comments »

Split Markets Require Open Minds

The following is just a small excerpt from my latest Weekly Strategy Session (please click on that hyperlink for details about trying it out). which I published for members and 12631 subscribers this past Sunday. 

An examination of the housing and housing-related stocks can help us drive home several key points this weekend.

First, the homebuilders have been one of the weaker ends of the market of late, in addition to small and micro caps, as well as regional banks. On the homebuilder ETF daily chart, note the highlighted topping pattern which confirmed lower into the end of July, before the recent bounce attempt ensued.

To be sure, a bounce up to the declining 50-day moving average (dark blue line) over $31 could easily materialize, especially if the broad market upside reversal during Thursday night’s futures session proved to be a major false breakdown/bear trap.

Nonetheless, the fact remains that homebuilders have sustained serious technical damage. The ETF now has a declining 150-day moving average (red line) and a flat 200-day moving average (yellow line). Should that 200-day moving average now begin to slope lower, it would add credence to any notion of a major bullish-to-bearish multi-year reversal.

Put another way, the homebuilders are now in grave danger in the coming weeks of topping out since their October 2011 bull run began.

Consistent with our ongoing thesis about the current bifurcated market with divergences everywhere, the housing-related retail stocks refuse to follow the homebuilders lower.

In fact, retail housing giants such as Home Depot and Lowe’s have both worked off very long-term overbought conditions on their monthly charts, below. That need not guarantee they resolve higher. But it is worth keeping an open mind to the idea that stocks can correct in two manners: Through a price pullback, or through time (marking time by price grinding sideways).

Here, it was noted in these Strategy Sessions that HD LOW had unsustainably steep angles of ascent on their respective long-term charts. However, the purpose of that analysis was not to call a major top, but rather to help swing traders eliminate one of three potential scenarios in the near future: Up, down, or sideways. In that case, we eliminated “up,” based on the abnormally steep angles of ascent.

Now that those steep angles have been corrected through time, though, we are back to being open-minded about the potential for HD LOW to surprise to the upside from their respective monthly consolidations and technical bases, highlighted below.

Hence….

Please click here to continue reading

Comments »

Finish Him! Stocks

finnish-hymn-540x531

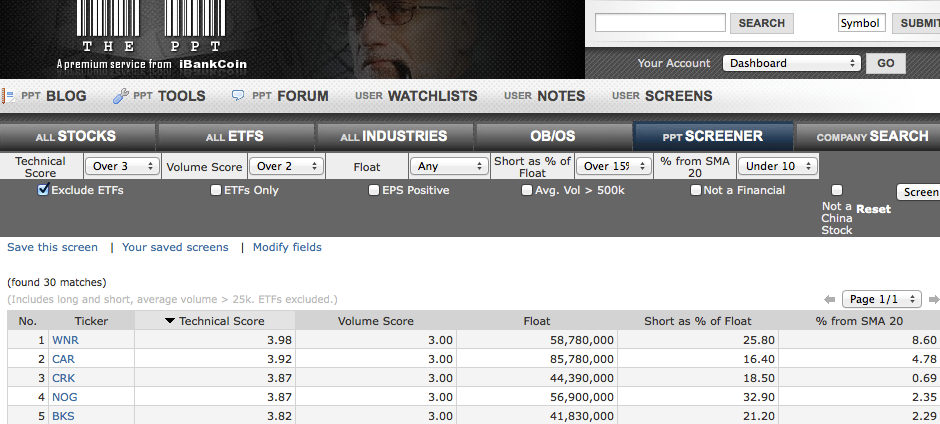
In the event we see heavily-shorted names squeeze again this week, here are some actionable long ideas.

Please click the screen shot below for a larger view of my “12631 FINISH HIM! SHORT KILLER SCREEN” inside The PPT. Obviously these stocks are going to have the highest percentage of shorts and, according to the algorithm, are set up well to squeeze further.

If this bull goes buck wild, this is a great idea screen.

Members can click here to view and save it.

____________________________________________________________

2014-08-11_0004


Comments »

Late Night Strategy for Monday

K8QO6ha

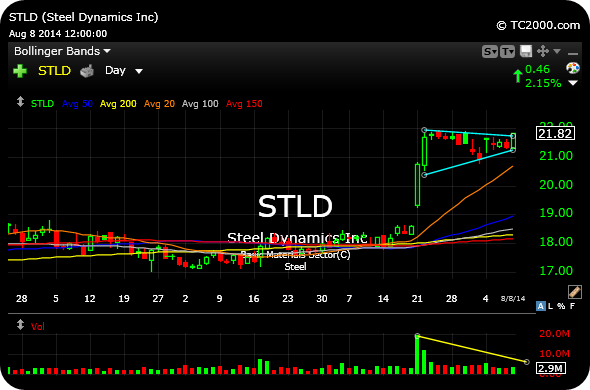
Should the market offer up a further bounce this week, keep an eye on Steel Dynamics to resolve higher from the tight bullish consolidation, below.

We have looked at this one before as a long idea, due to strength in steels and the merits of its own chart. I like it on any further strength with a stop-loss below $20.50.

On the short side, keep an eye on any weakness in the consumers staples, as quite a few are bear-flagging here.

Drop me your top tickers overnight.

________________________________________________________

STLD

Comments »

Sotheby’s Something to Scream At

Scream sets auction record

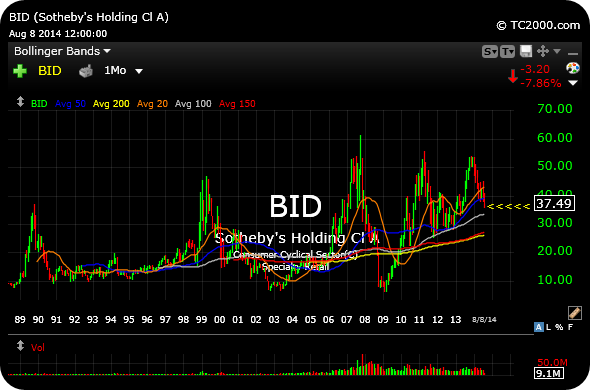
For those of you who followed by “Sotheby’s Indicator” analysis since 2013, the stock gapped down hard late-last week after earnings, perpetrating its 2014-long correction.

As you can see on the multi-decade chart, the high end auction house has peaked at each major stock market turning point.

Thus, we have another glaring divergence to keep on our screens.

Also be sure to check out my published Weekly Strategy Session, as well as The Fly’s latest post and survey.

______________________________________

BID

Comments »