In addition to Bollinger Bands being useful technical indicators (but not anything close to magic or the Holy Grail) for measuring short-term relative tops and bottoms by the upper and lower Bands, they can also put us on watch for when a large directional move is imminent.
Periods of compressed price action often lead to periods of explosion. And when we see the Bollinger Bands themselves “pinched” in on a given timeframe, it is an indication that resolution from that compression is likely imminent. This technical development is indicative of low implied volatility in the stock, as a general proposition.
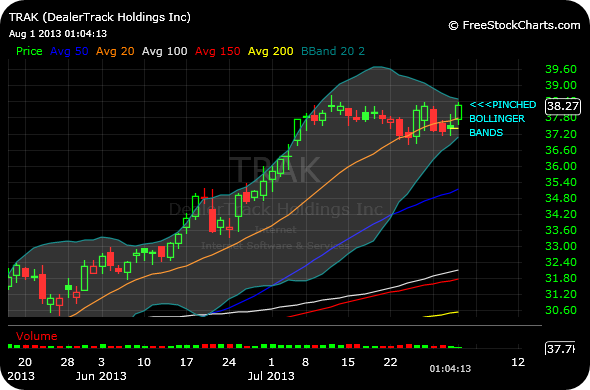
To give a real-time example, let us consider TRAK, a small web software firm. They report earnings on August 5th, I believe, so the stock may very well be sitting in front of that as a catalyst/excuse for its next big move. But what we have here is a chart in a clear uptrend, with rising daily chart moving average properly aligned (20-day, then 50, then 100 etc.).
You can see the Bollinger Band pinching in on this daily here as the consolidation develops. The pinched Bands do not reveal which direction the resolution will occur, but the overarching trend is often a useful guide if you are going to pick a side. Again, earnings are probably a wildcard here.
But this shows another useful way to use Bollinger Bands as an objective measure of when the market is telling us that chart is likely ripe to make its next big move.
_______________________________________________


Using different time frames give different range for BB, ex. 1 year to 10 years, so do you think it’s still fine if the stock is in the BB of longer term even if beyond short term BB range ? Thanks Chess.
depends on timeframe for your trade/thesis