You already know my thoughts on the long-term structure of Visa as a quite stretched (f not legendary) rubber band now showing signs of snapping.
But in this blog post let us take a look at Visa for an intraday trade. Knowing your timeframe as a trader is always key, of course.
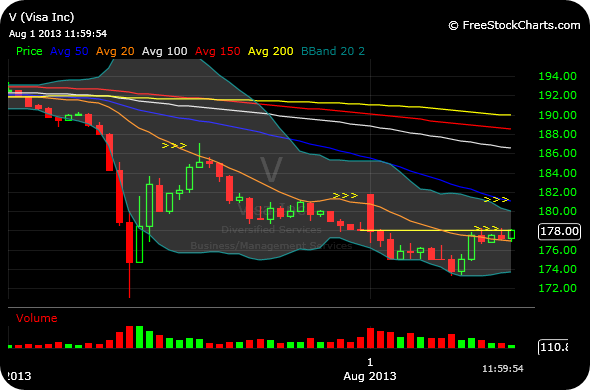
Here, we are looking at a 10-minute chart stretching back to yesterday’s sharp decline. You will note that the 20-period moving average on this timeframe acted as resistance the whole way down (yellow arrows).
As I write this, though, the stock is trying to now base sideways along it, as opposed to being rejected back down like the previous times. You will also note it had previously hit its lower Bollinger Band (again, on this short-term timeframe), before reverting back to the “middle Bollinger Band,” which is the 20-period moving average. This is the same type of analysis we did on the precious metals and miners a few weeks back which gave a nice trade on NUGT long.
To be sure, it does not always work, or anything close to it, which is why a stop-loss below the middle Band makes sense if you play for a long. But you are targeting the upper Bollinger Band a few points higher for a quick trade under this theory of the setup.
And by the same token, if Visa cannot even muster this rally intraday, it could easily be a sign and valuable information of a more meaningful change in character in the stock for the worst after years of being unstoppable.
________________________________________


Hah love the picture!
Thanks, was a lucky find.
used same chart for HD-encouraging for short position
They’re not making it easy, that’s for sure!