The energy, materials, and many industrial stocks all suffered notable damage on Wednesday, thus delaying any potential capital rotations until they can repair themselves, at a minimum. Unlike in late-2007 through mid-2008, when the energy/materials/industrials soared in conjunction with crude oil stampeding towards $150/barrel, what has made this particular prospect of rotation into these sectors all the more difficult to gauge is the fact that crude has essentially come to a grinding halt.
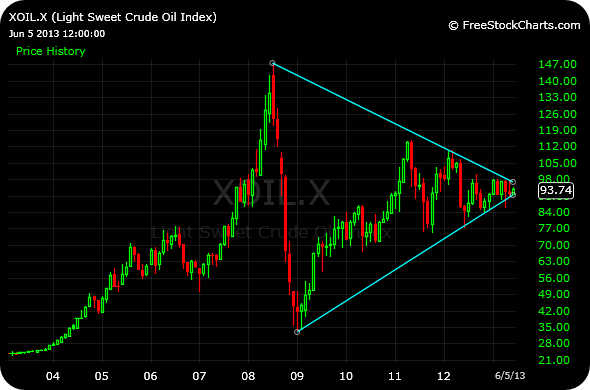
The very long-term monthly chart of light sweet crude, below, indicates that since the historic run-up and crash in 2008, crude has worked through an obvious symmetrical triangle pattern, with price making a series of lower highs but also higher lows. The multi-decade trend of crude is of course higher. And according to Edwards and Magee, roughly 75% of symmetrical triangles are continuation patterns, meaning the presumption is that crude will resolve sharply higher. After all, we are talking about a massive triangle with tons of pent-up demand.
However, one of the finer points about the chart below is that price has essentially worked all the way towards the apex of the triangle. While it looks prettier to see price compress tighter and tighter, Edwards and Magee have also noted that this event tends to weaken the eventual breakout, even if it is higher–It is usually far more bullish and powerful when you see an upside breakout roughly 3/4 before the apex is reached by price (indicating insatiable appetite for the asset in question).
Furthermore, when you form such a widely-watched pattern, the odds of a fake-out rise considerably, meaning we see a move one way which gets many players in the oil market excited, only to see crude turn on a dime and sprint the other way for the real move.
We can yearn all we want for the days in early-2008 when all you had to do was go long Potash, Chesapeake, or James River Coal, and look for things to short in other areas of the market. But we are dealing with a different beast here, and a head-fake higher followed by a reversal lower would be my best guess for crude solely based on this technical analysis.
_____________________________________________


Agreed. Wtf oil is doing still in the nineties is curious. America! Fracking! Four dollar gasoline is not doable in the land of bullet proof glass at the local bank. Hoping the fake breakout happens.
….or could it be a short head fake lower, and then zoom higher!. “To be or not to be” is the statement question.
just filled tank 4.49 high grade..arrg!!
Mi has 2nd highest gas prices in Nation just below Hawaii. Now that’s BS..
;)))
not so abnormal as they always spike heading into, up north..and Mac Island)tourist season..hmm?
grammar issue ^..
yep..
Mac Island, where there’s tons of horse shit everywhere.