
When I wrote, “Careful Shorting the Precious Metals and Miners Here” last week, part of the reasoning to not get caught leaning short even with the metals and miners in clear downtrends was the analysis we did of a particular technical indicator, in conjunction with other factors discussed in that post.
Specifically, I said:
To support that notion (of not getting caught short), consider the daily charts for the metals and the miner ETFs…Note how the Bollinger Bands were pinching in prior to this most recent leg lower. We saw a swift move down before yesterday’s dramatic reversal (higher). What you often see with pinched (Bollinger Bands) is a false move one way which stops on a dime before the “real move” occurs in the other direction. The pinched in Bands indicate compression in price, which often leads to explosion–The trick, of course, if figuring out which way we see the explosion. (Emphasis Added)
In light of the strong price action in the semiconductors for most of Thursday’s trading session before a minor fade into the closing bell, let us now apply that Bollinger analysis from the precious metals and miners over towards the semis. In addition to the industrial/material/energy global complex, the semis could easily represent a logical beneficiary for sector rotation if the bull has horns into the summer months.
Thus, once again, the stakes are high and we need to be on the ball.
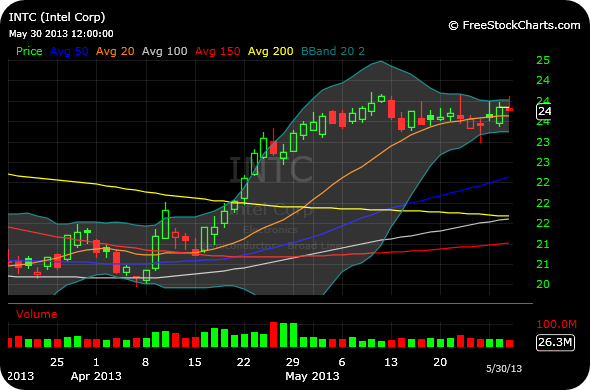
It is hard to imagine the semis leading the charge higher without mega cap bellwether Intel at least holding the line. In other words, Intel almost assuredly needs to not be currently in the process of springing a bull trap, if the semis as a whole are going to act like leaders going forward.
With this in mind, consider the daily chart of Intel, first below. The stock reversed from green to red on Thursday, which bears could easily cherry-pick as prima facie evidence of a bull trap.
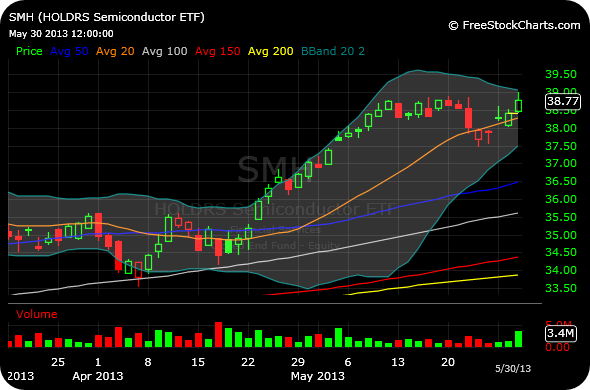
But we should be more rigorous than that. And delving deeper into that Intel daily we can see just how pinched in those Bollinger Bands are at this point in time. Indeed, a big move is likely to happen soon, since periods of compression often lead to explosions. And if that slight breach today of the upper Bollinger Bands leads to follow-through weakness tomorrow and early next week, then the flip side of the precious metals and miners argument must be taken very seriously, meaning a true bull trap is at hand. In addition, note the second chart below for the sector ETF of the semis, also sporting pinched Bollinger Bands, with a strong move for most of Thursday but an unimpressive close.
It sure seems like the semis *should* break higher and lead the charge in the next leg of this bull market. But it also seemed to many trend followers that the metals and miners were simply consolidating before another leg higher. That may happen eventually, but is not much consolation when NUGT rallies from $8 to nearly $12 within a matter of days and you are caught short, “riding the prevailing trend lower.”
______________________________________
______________________________________


One comment
Pingback: Chaikin Semis, Not Stirred | chessNwine