
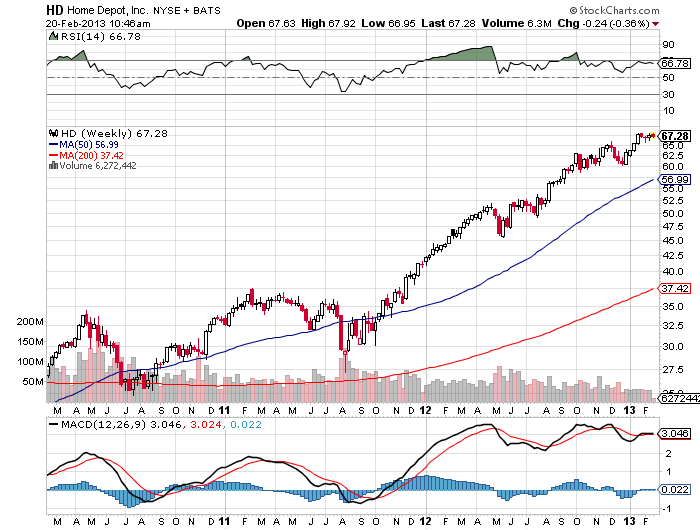
I present the weekly chart of Home Depot first below to illustrate the longer-term RSI divergence (top pane of chart) which has been building. Home Depot has essentially gone flat for the past several weeks. And this divergence is still worth watching as we await the next big move.
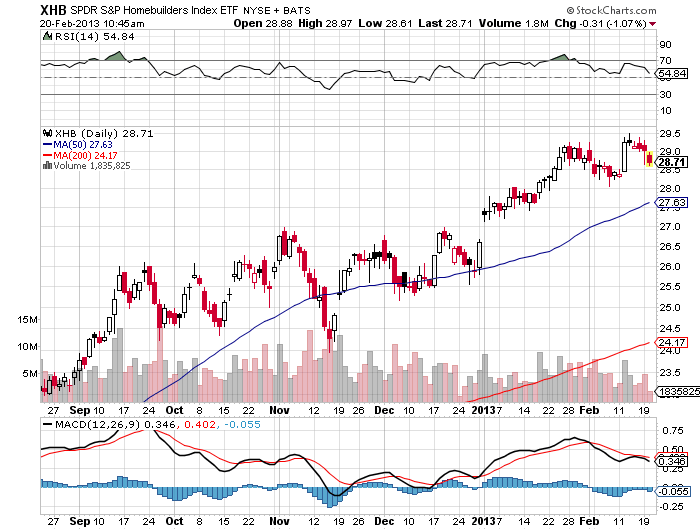
Along those lines, the homebuilder ETF daily chart, second below, has been relatively weak over the past few sessions after several quarters of strong market outperformance. Here, again, the top pane shows us a negative RSI divergence to price.
The notion of a resurgent housing market has become increasingly accepted in recent months. With lumber weak the past two days, keeping an open mind that upside may be limited from here for the sector, as good news has been priced in, is important as we watch these divergences play out one way or the other.
___________________________________
___________________________________


Good eye.
da Flea is not gonna like this!
Please don’t tell me HD is going down the path of WMT.. Oh, those people of Walmart..NOooo, please say it isn’t so.
Is that a cork board to pin photos of his girl of the day..hmm?
Sporting a Polar Bear coat and hat at the Depot.