
The below chart of Zillow stretches back to when it IPO’d last year. As I have written before, if you are a technical trader looking at charts then you should be resisting the temptation to trade these things while they do their initiation dances in the first several months. There is not much of an edge for swing traders, perhaps none at all, when the chart has yet to reveal any kind of character. Beyond that, in a post dot-com bubble secular bear market, plenty of IPOs have not been well-received at first, and have actually been quite punishing.
It is usually only a few quarters after the IPO that you see a chart like Z start to firm up and form a tradable pattern such as the bullish cup and handle breakout below. The patience to wait for IPO’s to offer up something more than an ephemeral and ultimately doomed three or four day exuberant rally in the initial weeks and months of its public offering can often be the difference between suffering a huge loss versus nailing down a big win.
Generally speaking, waiting at least three-to-six months post-IPO is suggested to allow the stock to form a chart even worth analyzing.
_____________________________
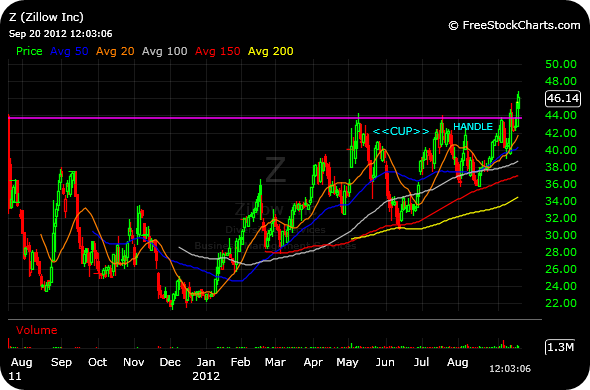


I like Zillow. Check out the weekly 33 EMA, it’s supported price well since forming in March.