Okay, so lets get started in the quantifiable approach to position sizing. The intro sort of explained what I am trying to accomplish.
Part 1 WoodShedder Time! Creating A Quantifiable Approach To Position Sizing
Part 2 Building A “Position System Simulator
Part 3 Building Cover Sheet, Determining Probability of Results (Position Size Simulator Part 2)
Part 4 Adding To The Cover Sheet
Part 5: Setting Up The Calculations
The first step is to conceptualize how we are going to simulate a position size and what we are going to accomplish. I don’t want the typical “Monte Carlo simulation” where you have the data spit out a TON of series of trades using some sort of random number generator and determine the results based upon that randomness. I have found other people who have done that.
What I basically am looking for is a tool that will–given a set of basic expectations of the trade–determine the probability that at the given bet size that I will finish down 20% after 100 trades. I could just look at total draw-down perhaps within those 100 trades, but that may be a little more complex in determining all the possible combination of trades that draw down. We will see.
I may also want to know the probability that I draw-down 50%. I also will want to know the probability that I hit a certain “threshold” for gains as well such as 100% after 100 trades. The idea is I may want to find the bet size that maximizes my chances of reaching my “goal result” after 100 trades using a system (or 10 years at 100 trades per year or whatever) and by knowing the system, I can predict the time and also know the risks.
For some goal result could be what you need to walk away from trading. For others it could be the amount you need to reach to retire. For others, it might just mark a change in strategy to a more long term oriented approach or more passive index ETF based strategy. Or maybe it allows you to go buy that business franchise you wanted.
This to me is far more productive than “optimizing your overall maximum gain” which is insane. The Kelly Criterion, “optimal F” or other position sizing strategies often assume an infinite number of trades to weather the volatility storm. In reality those systems could give you a much worse chance of getting to where you want to be, and a far too high chance of having such a significant draw-down that it will take ages to even get back to even.
Some run a “Monte Carlo strategy” where it will simulate 50 trades or 500 trades with the click of a button, and then you can repeat that several times and each time you randomize, there is a different result. But I don’t like that because it doesn’t help me maximize anything, it just gives me a good idea of several possible results.
Instead I want to run all the permutations (possibilities) that a series of multiple trades can work out, and use the likelihood of each result and sum up the data that is beyond certain thresholds and determine an exact percentage chance of achieving that result.
Unfortunately, the number of cells available for computation on excel may make a large number of trades difficult. In the version of excel I use, there are 1,048,576 cell rows available. For just 10 trades involving 5 possible outcomes, you have 5^10=9,765,625 combinations of results. If we cut this to 4 possible outcomes we have exactly enough cells. 4^10=1,048,576
Determining probabilities and results after only 10 trades is not really all that valuable. Instead, I will have to have one spreadsheet give me the data for a group of say 5 trades, then use that data to group in chunks of 5 trades what can happen, and then 5 groups of 5 trades to produce 25 trades, and then 5 groups of 25 to produce 125 trades. This is good enough for me to give me the kind of picture I am looking for.
This way the formulas can give me data, I can quick determine new data, plug that in the next spreadsheet tab and then gather new data and input that into the final spreadsheet tab (or have it automatically pull to the next spreadsheet tab if set up right).
What I plan to do, is set aside a macros that will automatically list all permutations for say 5 trades that you could have a result by putting up a number 1 through 5 that corresponds to a certain result.
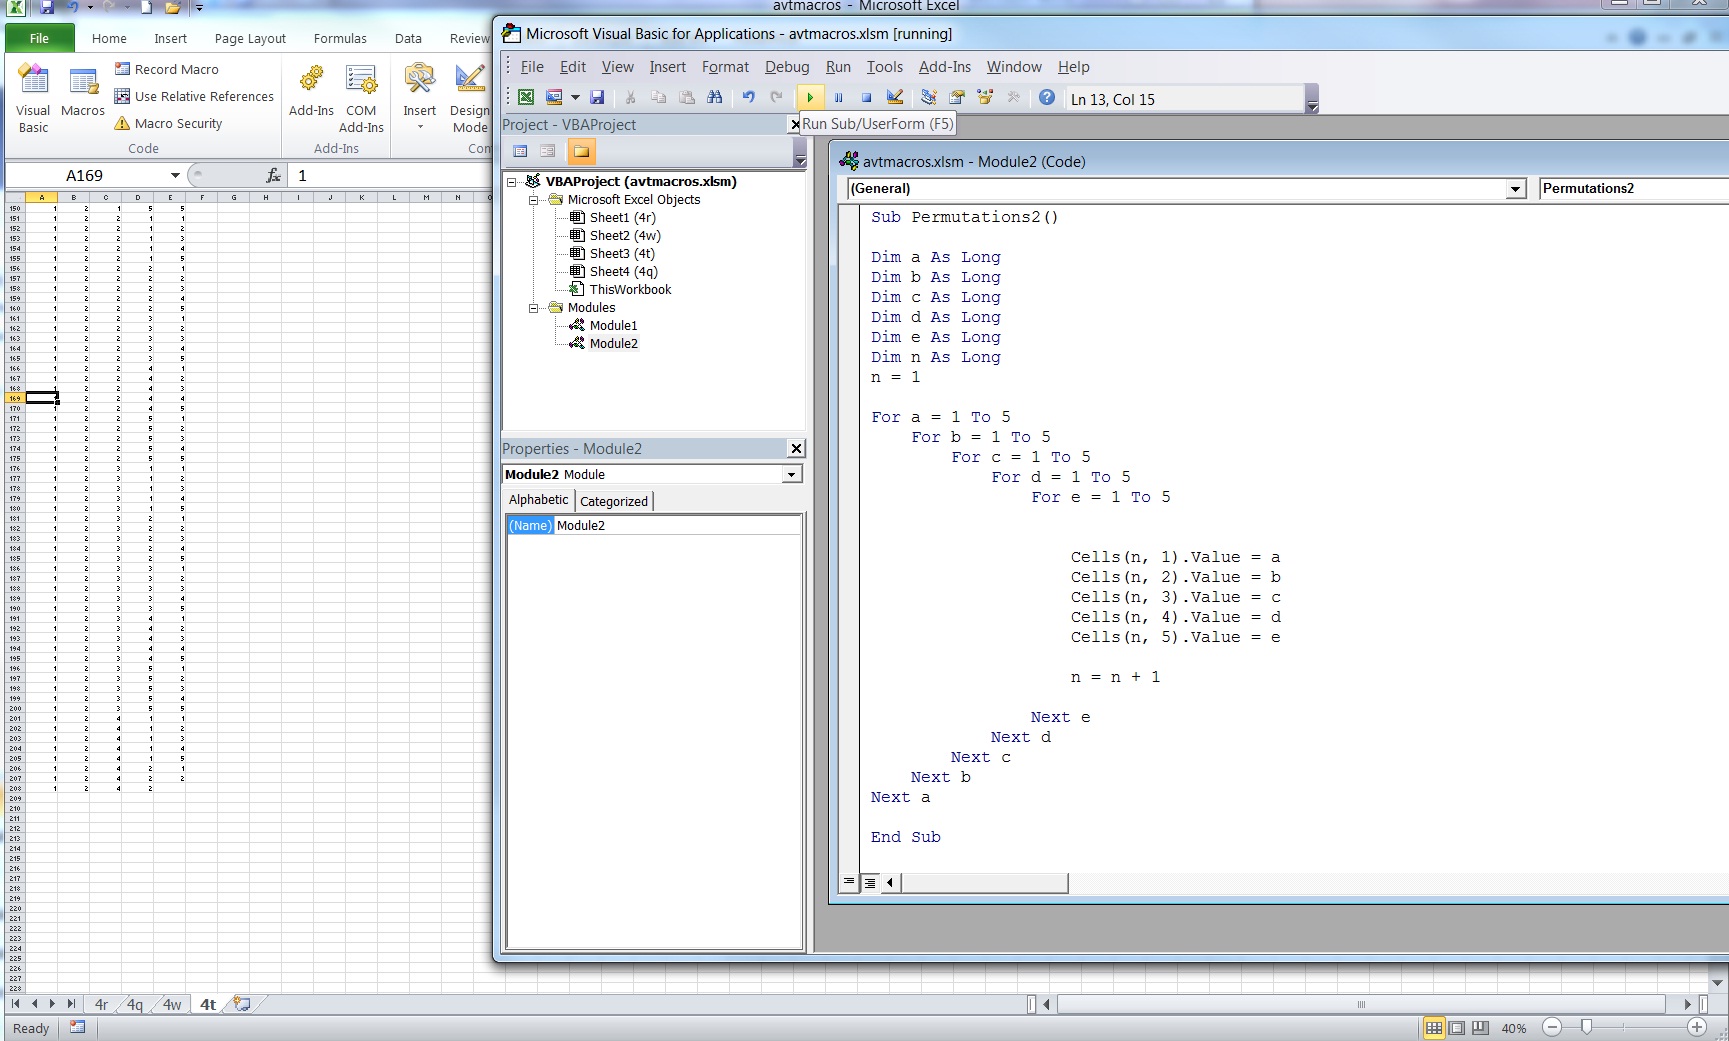
As you can see the macros is running. It automatically spits out a number 1 through 5 and goes over all possible combinations of ways you can have a set of 5, 5 digit numbers. You can also see the formula that I set up in visual basics to run it. It was very difficult to get a screen shot of it midway through the process like this because it is very quick, but I did.
The next step is to copy and paste the data first directly next to the other data and THEN take that and copy and paste it into multiple sheets since there will be multiple groupings of 5 trades and the results of each of them. One of the sets of data is for the probability, the other is for the ROI given those sets of circumstances. You will see this done in a later post.
Then a find and replace function can be set up to replace each number with a formula that will pull from a “cover sheet” the data, as briefly mentioned in the introduction. [W1-W4, R1-R4, bet size]. I will then need to add another set of data that determines for each potential series of bets, a cash allocation percentage and what percentage into the system.
Eventually, my hope with the spreadsheet is that I can run the simulator for MULTIPLE trades at the same time at a given correlation run simultaneously. While I have constructed the spreadsheet/calculator that adjusts return for fees and multiple positions and given correlation based upon the “optimal bet percentage”, I have not yet figured out how I want to do this for the “simulator” yet.
Calculating multiple position sizes and determining the probability that both close down or up and by how much using only data such as correlation seems like a task that I am not quite sure how to do. Hopefully by talking my way through it I will come up with something as I develop this spreadsheet.
The next post I hope to accomplish a lot more and show you the developments of the spreadsheet. That’s all for today, class dismissed.
If you enjoy the content at iBankCoin, please follow us on Twitter


what are you basing your simulator on?
Meaning: what are the triggers and how are they determined?
This will be made to simulate the result of a portfolio after a set number of trades based upon certain customizable “expectations” and “position size”.
The “set expectations” and position size? It will be “user defined” and fully customizable.
What the user will do is input up to 5 ways the trade could turn out. (Lose 12%, lose 5%, break even, gain 5%, gain 30%) For each of those 5 “events”, they then list the probability of that “event” (given ROI) occurring.
Then they will list starting bankroll, cost per trade (fees), other data, and of course position size.
The spreadsheet will quickly allow them to be able to take that set of data and determine things. Such as answer.. “based upon these “expectations” and position size, what is the probability of having a certain result (i.e. greater than 100% after 125 trades, less than a 20% loss)?”
Or answer what the odds of being up 50% after say 125 trades. Or what the mean and median bankroll size is after 125 trades and things like this.
I call it a “simulator” because with every set of data+trading parameters you give it, it maps out all the ways a trading system over a set number of trades could play out, weights according to probability, and then summarizes the data. Effectively you adjust “position size”, have all the possible results simulated, and adjust position size again until you get a result you are satisfied with based upon your own parameters to “optimize” the bet size for a given “trading system”for your tastes.
Hope I explained it well, it will be more clear I think once it is complete and you see it in action.