Part 1 WoodShedder Time! Creating A Quantifiable Approach To Position Sizing
Part 2 Building A “Position System Simulator”
Part 3 Building Cover Sheet, Determining Probability of Results
Part 4 Adding To The Cover Sheet
Part 5: Setting Up The Calculations
In this part, we will go over as the title suggests, building a cover sheet. Ultimately this will summarize all the data on one sheet so it will be the only sheet we need to look at and adjust. We will then set up a formula to help us to determine the probability of each individual possible outcome of the 5 trades we have set up. Once you have all the possible combination of outcomes plotted from the first part, it’s time to begin to build a “cover sheet”.
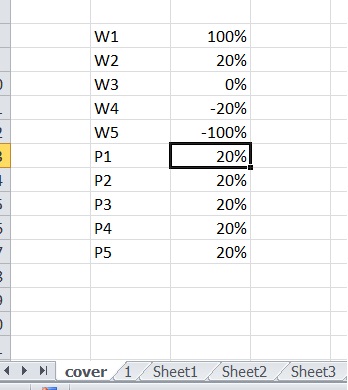
The cover sheet will have all the “adjustments” made to the system on it. For example, you basically list how you manage your trade and the probabilities. W stands for your “win ratio” or your edge or ROI
w1 -20%
w2 -10%
w3 0%
W4 10%
W5 20%
This would signal that your system either takes a 10% loss or 20% loss and targets a 10% gain or 20% gain. The next portion assigns probability to that system.
P1 10%
P2 25%
P3 20%
P4 25%
P5 20%
Would indicate that you have a 10% chance of hitting your 20% loss, a 25% chance of hitting a 10% loss, a 20% of scratching out for an average of no gain, a 25% chance of a 10% profit and a 20% chance of a 20% profit.
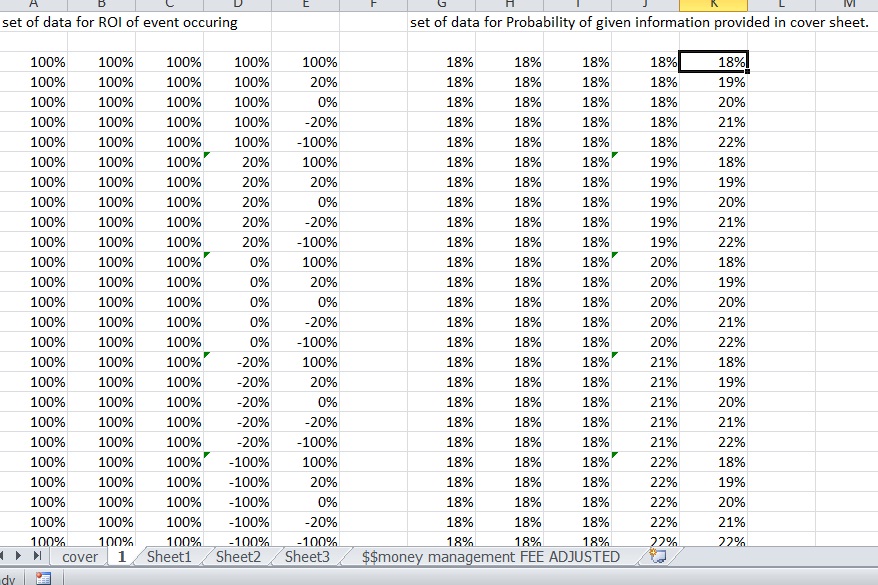
So you make a cover sheet that for starters can be real simple and look something like this. It really doesn’t matter at this point what the data is, you will adjust that for your system once it’s done.
More will be added to this cover sheet later. The goal is to not have to look at any of the other sheets unless you are adding some other feature or modifying it. Once you are done, the cover sheet will be where you input the data AND give you all the information you need to draw any conclusions.
Now you can go back to your other sheet and use the “find and replace function” (CTRL+H) to replace each of the numbers generated with the corresponding data on the cover sheet. You don’t just want the data because then you have to redo the spreadsheet every time. Instead you want it to put a formula in place of each cell that will pull from the cover sheet. So you create a find and replace something like this.
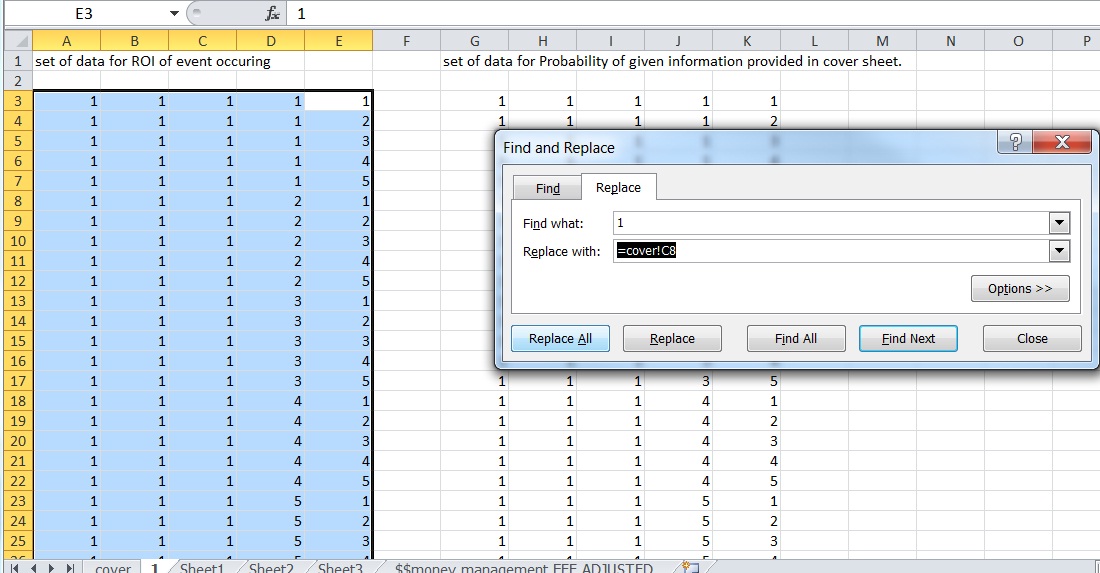
In this particular example, I find and replace all cells with a “1” in them with =cover!C8 which pulls the data in the C8 cell (of the tab labeled “cover”) and puts it in place of each cell with a 1. The C8 cell, in this case, is the data corresponding to W1. Then repeat for each number. The 1-5 should correspond to W1-W5.
(Warning, you may need to rename the numbers first if one of the numbers in the formula you just created contains that particular number so you don’t end up changing it. Such as replacing the 1 with 11111, the 2 with 22222 and so on. This way if you have the formula as =cover!C10 and you find and replace the 1 it won’t change it to something like =cover!C=cover!C90. Also note that I had to highlight the cells I want to replace, otherwise it would have also replaced the ones next to it that are designated for P1-P5.)
Repeat for P1-P5 corresponding to the coversheet P1-P5.
Now we need to start with some sort of actual value and we will be able to see IF this scenario plays out what our portfolio will do. But that will be saved for another time. We also need to calculate the “probability” of that set of 5 trades in a row of occurring. With this information we will be able come up with things such as “probability of a return over X after 5 trades”. The idea is then to leverage that information to give us a probability of certain returns over 125 trades. I’m not yet sure what issues I will run into yet so one step at a time.
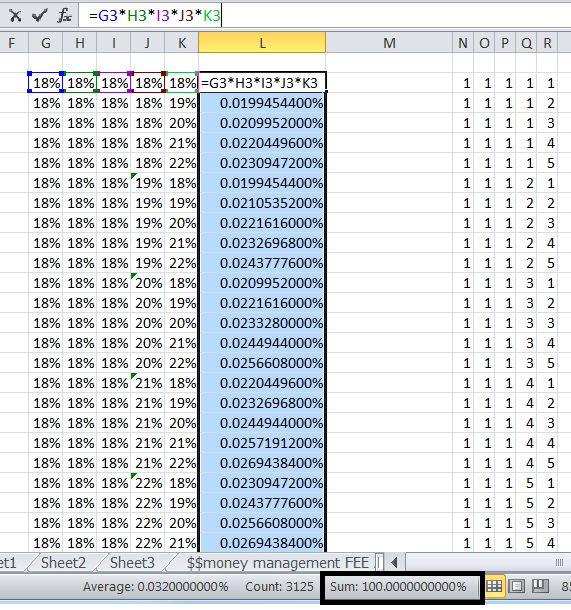
To get the probability of a particular individual event happening for each event, you simply multiply each of the cells dedicated towards probability or your “P1-P5” amounts together. Check your work by ensuring the sum of all these adds up to 100%.
I am hoping that people by this point are starting to “get” what I am doing and trying to do a little more. It is sometimes a bit difficult understanding formatting, programming and mathematical concepts and then translating that to language and hoping the people reading actually get something out of it. I think it is a little easier to show you images like this. But I appreciate those who bear with me through this process.
Bet sizing and making sure your “system” AND bet size both work together to accomplish your goals and risk tolerance is of utmost importance.
At risk of sounding repetitive, in order to drill down what I am saying, I will continue to rephrase it… one side of the equation is “what’s one possible “return” given a set of data (for all possible sets of returns over 5 trades)”. The other side of the equation is “what’s the probability of each return occurring given this set of data (over the course of 5 consecutive trades)”. Once you have that you will be able to “sum” up and “sort” the data so you can determine the probability of each given set of returns.
For example, after 5 returns you will sort the overall portfolio “outcome” which will ultimately be a portfolio SIZE or percentage gain on your overall “bankroll”. You then can sum up all the data ABOVE or equal to a certain outcome. You then SUM up the probability of each outcome to determine the probability that you achieve a certain pace of returns.
If your goal over 10 years is to reach a certain “retirement” number, and you place 12.5 trades per year on average, you simply need to solve the optimal bet size and system to maximize the probability that you get there in 10 years by looking at the data over 125 trades and adjusting things like the bet size or valuing entire systems by their probability of getting you to your goals. Or perhaps you just need to not have a 20% drawdown. Then you simply look at the probability of a 20% drawdown and MINIMIZE it. Or perhaps you want the BEST return that you can get with a less than 30% chance of ending down 20% after a year of trade, or without having a full year that ends 20% from the last anytime throughout the 10 years (125 trades).
The simulator will not create a system for you, but will give you comfort in knowing that if you can find reliable data, you can maximize chance of reaching retirement or minimize your chance of a 20% drawdown, or whatever your goals are.
But we are getting ahead of ourselves here since this is still under construction and you will have to continue reading this series to see how I build the spreadsheet to accomplish this task.
—————————————————————————————————————————————–
Before we jump into determining a “return” after 5 trades, the next thing that will be adjusted is “how much” to risk per trade. We will have to update the cover sheet to include things like “starting bankroll, fee per trade, % of capital allocated per trade. We will have to use that data to come up with a formula to come up with an “ending amount”, after the series of 5 trades, and have it calculated automatically for each row. But that will all be covered in the next post.
If you enjoy the content at iBankCoin, please follow us on Twitter