iBankCoin
Joined Nov 29, 2008
329 Blog Posts

06/08-09/08+ = 10/08-01/09+?

Looks Pretty:

I was twittering all day that we were forming a symmetrical triangle, then an ascending triangle. The breakdown of the triangle set off a cascade down from 12:30PM to 2:00PM. And then, from 2:30PM till 4:00PM, many people got mauled. It is a fact.

Just when you thought that the market was going to breakdown at 3:00PM, you got screwed. The movement in the last hour was definitely impressive, nothing short of a spectacular come back. It made you say “WTF?!”, didn’t it?

The only trades I made were closing out positions in the morning. It’s typically not good to trade on doji days also known as tight-range indecision days marked by very little volatility. Doji tell you that the bulls and bears fought all day long, and neither side could best the other. The market could go 50/50 from here. I did not trade all day long because there was no edge. Did you see one?

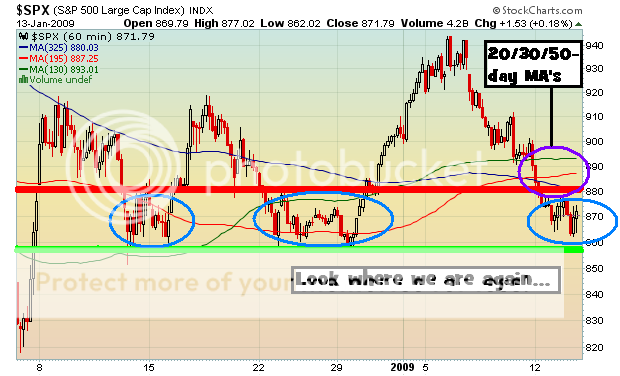
We are very close to 857-860 once again. In addition, all three 20-, 30-, and 50-day MA’s are above the SPX, no doubt going to make the SPX’s rally attempt laborious and very irritating. The downside is not that far, in fact, a breakdown is waiting only about 12-15 pts below. Watch the charts, they’ll tell you where YOU need to be.

SPX 1-day

SPX 3-day

SPX 40-day

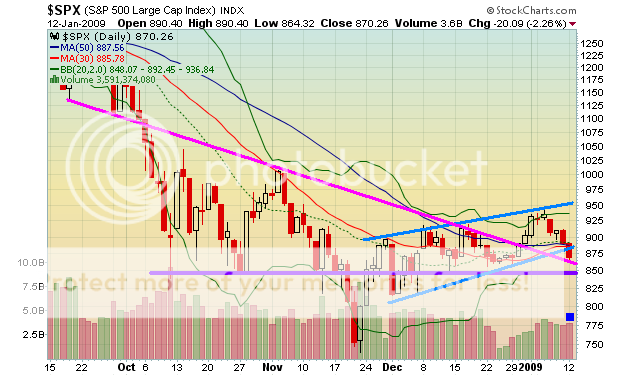
Here’s a very important observation I made today. Below is a 3.5 month chart of the SPX  right now. Below that is a chart of the SPX from 06/08 – 09/08. See any similarities?

1) Price/Volume Divergence – The rally heads higher, but volume isn’t sustained. Here is where volume will be important. Once the range is broken, a burst of volume should be present.

2) 50-day MA Churning – Churning is the equivalent of “hanging out”. In this case, the SPX has repeatedly made numerous attempts to rally on both charts, passing and failing over and over until the MA could no long support the market.

3) Bollinger Bands – The BB’s are currently at their narrowest levels since the August-September rally. The market was in an approx. 50 point range before a major move occured (down). The market right now is in an approx. 87 point range. The more narrow the bands, the more explosive the future move.

4) V-Spike Bottom
– Look carefully at both charts and compare their rallies since the first long white candle and it’s trek upwards. It’s similar enough to not ignore.

Keep these things in mind. I’m not saying it’s going to be this way, but it’s nice to know, right?

Finally, PPT requests from a cool person (PEP, TOT, LH, AFFX):

No.    Date    Rank – Daily    Close    Technicals    Fundamentals    Hybrid Score    Hybrid Change
1     2009-01-13     1147     52.02     1.64     3.96    2.61 (Sell)     6.97%
2     2009-01-12     1288     51.39     1.34     3.96    2.44 (Sell)     -5.43%
3     2009-01-09     1110     52.57     1.59     3.96    2.58 (Sell)     0.39%
4     2009-01-08     1527     53.25     1.57     3.96    2.57 (Sell)     1.18%
5     2009-01-07     1380     53.89     1.56     3.91    2.54 (Sell)     -4.87%
6     2009-01-06     1988     55.70     1.78     3.91    2.67 (Sell)     2.30%
7     2009-01-05     2125     55.60     1.68     3.91    2.61 (Sell)     -13.58%
8     2009-01-02     1425     55.97     2.35     3.95    3.02 (Buy)     10.22%
9     2008-12-31     1909     54.77     1.87     3.95    2.74 (Sell)     -4.20%
10     2008-12-30         54.88     2.18     3.82    2.86 (Sell)     22.75%
11     2008-12-29         54.07     1.26     3.82    2.33 (Sell)     -5.67%
12     2008-12-26     956     54.56     1.50     3.82    2.47 (Sell)     0.00%
13     2008-12-24     1201     54.54     1.75     3.82    2.62 (Sell)     4.80%
14     2008-12-23     1707     54.17     1.55     3.82    2.50 (Sell)     -11.97%
15     2008-12-19     1132     54.09     2.14     3.82    2.84 (Sell)     -10.41%
16     2008-12-18     434     54.71     2.70     3.82    3.17 (Buy)     0.63%
17     2008-12-17     680     54.33     2.68     3.82    3.15 (Buy)     8.25%
18     2008-12-16     954     54.21     2.26     3.82    2.91 (Sell)     14.57%
19     2008-12-15     1442     52.42     1.62     3.82    2.54 (Sell)     3.67%
20     2008-12-12     1861     52.03     1.46     3.82    2.45 (Sell)     0.41%

No.    Date    Rank – Daily    Close    Technicals    Fundamentals    Hybrid Score    Hybrid Change
1     2009-01-13     1064     51.85     1.00     4.90    2.64 (Sell)     7.76%
2     2009-01-12     1266     52.73     0.68     4.90    2.45 (Sell)     -9.59%
3     2009-01-09     706     53.64     1.12     4.90    2.71 (Sell)     -2.87%
4     2009-01-08     822     55.97     1.25     4.90    2.79 (Sell)     25.11%
5     2009-01-07     2174     54.85     0.30     4.90    2.23 (Sell)     -26.89%
6     2009-01-06     1042     56.28     1.71     4.90    3.05 (Buy)     -5.57%
7     2009-01-05     736     56.57     2.01     4.90    3.23 (Buy)     -13.64%
8     2009-01-02     106     57.56     2.90     4.90    3.74 (Buy)     7.78%
9     2008-12-31     235     55.30     2.43     4.90    3.47 (Buy)     13.03%
10     2008-12-30         55.30     1.83     4.78    3.07 (Buy)     0.66%
11     2008-12-29         54.07     1.80     4.78    3.05 (Buy)     15.53%
12     2008-12-26     411     53.90     1.08     4.78    2.64 (Sell)     0.76%
13     2008-12-24     1266     53.05     1.02     4.78    2.60 (Sell)     -9.09%
14     2008-12-23     672     53.12     1.46     4.78    2.86 (Sell)     1.42%
15     2008-12-19     1190     54.61     1.39     4.78    2.82 (Sell)     9.73%
16     2008-12-18     1807     56.20     0.96     4.78    2.57 (Sell)     -19.44%
17     2008-12-17     604     59.58     2.04     4.78    3.19 (Buy)     -6.45%
18     2008-12-16     142     58.07     2.42     4.78    3.41 (Buy)     36.95%
19     2008-12-15     1550     54.54     1.25     4.18    2.49 (Sell)     -11.39%
20     2008-12-12     933     53.88     1.38     4.78    2.81 (Sell)     -18.08%

No.    Date    Rank – Daily    Close    Technicals    Fundamentals    Hybrid Score    Hybrid Change
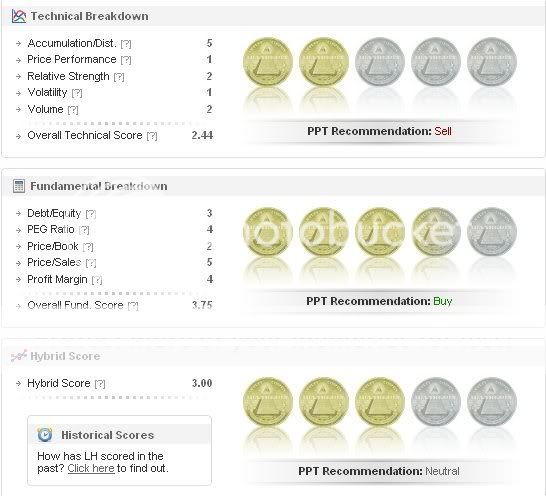
1     2009-01-13     277     61.47     2.44     3.75    3.00 (Neutral)     11.94%
2     2009-01-12     602     60.62     1.79     3.90    2.68 (Sell)     3.47%
3     2009-01-09     1080     60.85     1.64     3.90    2.59 (Sell)     -3.00%
4     2009-01-08     1159     60.72     1.77     3.90    2.67 (Sell)     -3.96%
5     2009-01-07     720     60.59     1.96     3.90    2.78 (Sell)     5.30%
6     2009-01-06     2047     61.40     1.73     3.90    2.64 (Sell)     -15.65%
7     2009-01-05     925     65.66     2.68     3.75    3.13 (Buy)     1.29%
8     2009-01-02     1264     64.93     2.60     3.75    3.09 (Buy)     4.75%
9     2008-12-31     1383     64.41     2.37     3.75    2.95 (Sell)     3.87%
10     2008-12-30         64.17     2.18     3.75    2.84 (Sell)     15.45%
11     2008-12-29         63.51     1.51     3.75    2.46 (Sell)     13.89%
12     2008-12-26     1688     62.93     1.00     3.75    2.16 (Sell)     -6.49%
13     2008-12-24     989     61.86     1.90     3.75    2.68 (Sell)     -1.11%
14     2008-12-23     1133     62.25     1.95     3.75    2.71 (Sell)     5.86%
15     2008-12-19     1929     63.10     1.69     3.75    2.56 (Sell)     -15.51%
16     2008-12-18     686     63.78     2.50     3.75    3.03 (Buy)     0.33%
17     2008-12-17     943     63.65     2.48     3.75    3.02 (Buy)     4.50%
18     2008-12-16     987     63.64     2.26     3.75    2.89 (Sell)     17.48%
19     2008-12-15     1629     61.33     1.42     3.90    2.46 (Sell)     1.23%
20     2008-12-12     1899     62.20     1.46     3.75    2.43 (Sell)     0.41%

No.    Date    Rank – Daily    Close    Technicals    Fundamentals    Hybrid Score    Hybrid Change
1     2009-01-13     2056     3.66     1.54     3.20    2.23 (Sell)     -1.33%
2     2009-01-12     1729     3.48     1.59     3.20    2.26 (Sell)     -21.25%
3     2009-01-09     387     3.84     2.64     3.20    2.87 (Sell)     4.74%
4     2009-01-08     959     3.58     2.42     3.20    2.74 (Sell)     11.84%
5     2009-01-07     1602     3.34     1.91     3.20    2.45 (Sell)     -9.93%
6     2009-01-06     1822     3.41     2.38     3.20    2.72 (Sell)     14.77%
7     2009-01-05     2646     3.16     1.78     3.20    2.37 (Sell)     -16.84%
8     2009-01-02     1811     3.12     2.60     3.20    2.85 (Sell)     0.00%
9     2008-12-31     1627     2.99     2.42     3.45    2.85 (Sell)     10.89%
10     2008-12-30         2.86     2.03     3.30    2.57 (Sell)     26.60%
11     2008-12-29         2.66     1.11     3.30    2.03 (Sell)     0.00%
12     2008-12-26     1993     2.66     1.10     3.30    2.03 (Sell)     0.00%
13     2008-12-24     2281     2.70     1.35     3.30    2.17 (Sell)     -7.66%
14     2008-12-23     2028     2.79     1.65     3.30    2.35 (Sell)     -3.29%
15     2008-12-19     2206     2.71     1.79     3.30    2.43 (Sell)     4.74%
16     2008-12-18     2345     2.70     1.60     3.30    2.32 (Sell)     -11.79%
17     2008-12-17     1847     2.88     2.13     3.30    2.63 (Sell)     20.64%
18     2008-12-16     2523     2.64     1.36     3.30    2.18 (Sell)     -4.39%
19     2008-12-15     2061     2.45     1.47     3.40    2.28 (Sell)     4.11%
20     2008-12-12     2417     2.45     1.31     3.40    2.19 (Sell)     2.34%

Comments »

Financials, Ag/Fertz, NH-NL, VIX, More PPT, etc.

Looks like the financials led the market. Down. As much as traders want to be all gung-ho long and everything, it’s important to keep an eye on the weakest sector. Take a look at C, JPM, WFC, BAC, and many smaller names. They all broke their uptrends. C, especially, formed a breakaway gap down on large volume. These types of gaps make it extremely difficult for a stock to recover in the short and intermediate-term.

So, what’s doing fairly well long-term? The utilities, because they haven’t been going anywhere. Other sectors such as the materials, industrials, consumer disc. & staples, among others, are threatening to break down. Yesterday, I mentioned that the market cannot rally without the financials. This remains true. The overall health of the market depends on this sector. In addition, we started making more new lows than highs. The $NYHL and $NAHL are negative once again.

As for index breakdowns, the DJIA is leading the decline, followed by the SPY, R2K, and the COMP. The important matter is how the market is churning at the 50-day MA. This has been going on for over a month now without much progress at this key intermediate support level. Usually, you want to see the market use the 50-day MA as a “springboard” to propel itself higher. It is presently not the case.

We still have one major support level at 855 to clear before we start a multi-day decline. The focus continues to be on the financials, especially C (and JPM on the 15th). The trend is intact until it isn’t. The financials have broken their trend and it appears that the market will follow for now.

SPX Initial Support: 860
Resistance: 20-day @ 892
Resistance: 30-day @ 885
Resistance: 50-day @ 882

Also, take a look at the VIX. It broke out via breakaway gap up:

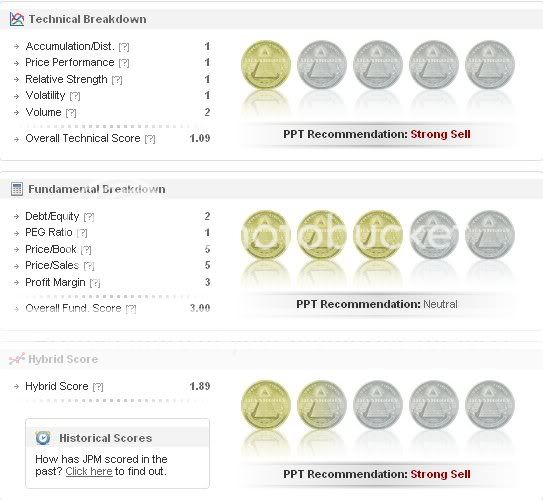
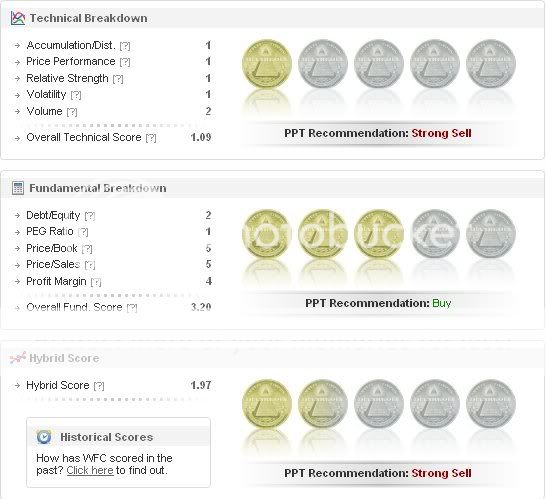
Here are the current PPT scores for select financials for anyone interested (historically, the big financials had “SELL” and “STRONG SELL” recommendations each day for the past 20 days):

In order (C, BAC, JPM, WFC, UYG)

————————–

————————–

————————–

————————–

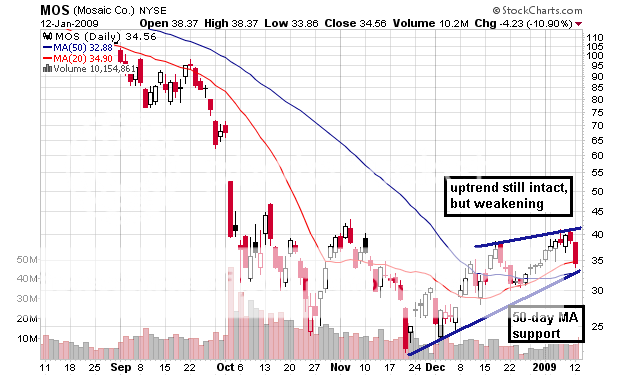
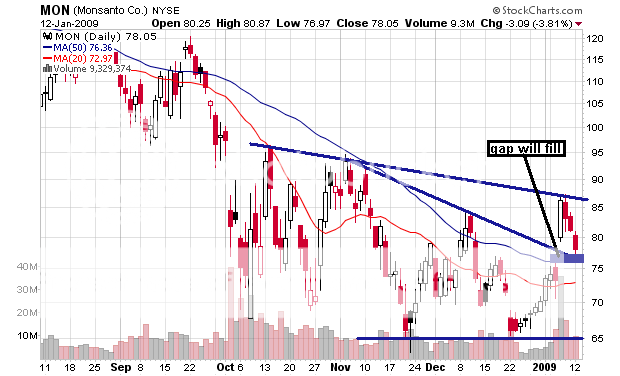
Also, Damon: fert/ag TA (POT, IPI, MOS, MON, CF, TRA, TNH)

A lot of these names are at their critical support levels, and may bounce. A breakdown from those levels is cause for concern. 1-2 days will tell. Cf & TRA are the weakest. POT & TNH were profiled by Cramer so becareful.

Comments »

0wned

Photobucket just 0wned me. Fuck them. I’m still using the account regardless.

We broke 880, but the decline was and still is very slow and on light volume. The financials are leading this decline, especially C. BAC, JPM, WFC, and many others have obviously broken their trends. If they don’t power rally end-of-day, they will become great swing trades on the short side. As always, watch out for late-day fuckery.

Comments »

Watch SPX 880 & Financials (PLUS: Final PPT Requests ADDED)

Watch for a bounce off of 880 on the SPX. If we slice through and breakdown from here, then we’re looking at 860 (again).

The financial sector is already breaking down. That will be my focus for today.The market will not be able to sustain a rally without the financials.

————————————————

MORE PPT REQUESTS:

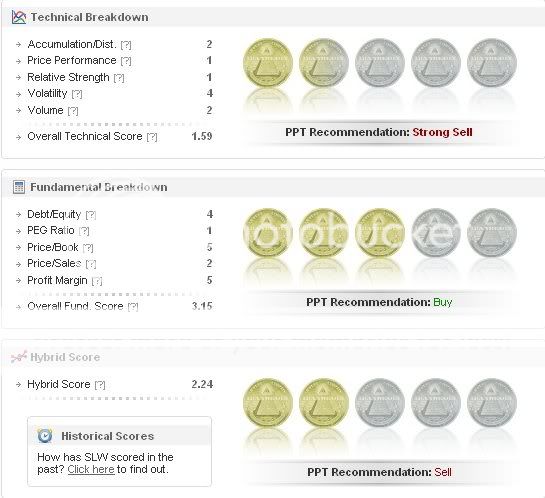
John – SLW, AEM

No.    Date    Rank – Daily    Close    Technicals    Fundamentals    Hybrid Score    Hybrid Change
1     2009-01-09     1983     6.18     1.59     3.15    2.24 (Sell)     -5.08%
2     2009-01-08     2008     6.15     1.80     3.15    2.36 (Sell)     12.92%
3     2009-01-07     2492     5.71     1.33     3.15    2.09 (Sell)     -8.33%
4     2009-01-06     2813     6.51     1.65     3.15    2.28 (Sell)     4.59%
5     2009-01-05     2909     6.25     1.48     3.15    2.18 (Sell)     -15.18%
6     2009-01-02     2511     6.58     2.15     3.15    2.57 (Sell)     9.83%
7     2008-12-31     2705     6.49     1.75     3.15    2.34 (Sell)     -4.49%
8     2008-12-30         6.41     1.95     3.15    2.45 (Sell)     -3.54%
9     2008-12-29         6.46     2.11     3.15    2.54 (Sell)     0.00%
10     2008-12-26     711     6.13     2.10     3.15    2.54 (Sell)     29.59%
11     2008-12-24     1821     5.64     1.81     3.15    2.37 (Sell)     1.28%
12     2008-12-23     2035     5.56     1.76     3.15    2.34 (Sell)     -9.65%
13     2008-12-19     1854     5.69     2.19     3.15    2.59 (Sell)     2.37%
14     2008-12-18     1886     5.40     2.09     3.15    2.53 (Sell)     -15.10%
15     2008-12-17     1033     6.14     2.86     3.15    2.98 (Sell)     3.83%
16     2008-12-16     1040     5.92     2.68     3.15    2.87 (Sell)     -1.37%
17     2008-12-15     469     5.07     2.74     3.15    2.91 (Sell)     6.20%
18     2008-12-12     1137     4.53     2.45     3.15    2.74 (Sell)     -6.80%
19     2008-12-11     554     4.34     2.79     3.15    2.94 (Sell)     4.26%
20     2008-12-10     1572     4.04     2.59     3.15    2.82 (Sell)     1.44%

No.    Date    Rank – Daily    Close    Technicals    Fundamentals    Hybrid Score    Hybrid Change
1     2009-01-09     1331     49.95     1.69     3.67    2.52 (Sell)     -9.68%
2     2009-01-08     879     50.34     2.16     3.67    2.79 (Sell)     30.99%
3     2009-01-07     2395     46.87     1.01     3.67    2.13 (Sell)     -26.04%
4     2009-01-06     1317     51.56     2.31     3.67    2.88 (Sell)     26.32%
5     2009-01-05     2786     49.65     1.27     3.67    2.28 (Sell)     -6.94%
6     2009-01-02     2708     50.95     1.57     3.67    2.45 (Sell)     -17.51%
7     2008-12-31     1355     51.33     2.46     3.67    2.97 (Sell)     12.08%
8     2008-12-30         50.24     1.91     3.66    2.65 (Sell)     -9.25%
9     2008-12-29         50.76     2.38     3.66    2.92 (Sell)     14.06%
10     2008-12-26     616     47.87     1.75     3.66    2.56 (Sell)     11.79%
11     2008-12-24     1104     47.09     1.89     3.66    2.64 (Sell)     5.18%
12     2008-12-23     1694     46.46     1.68     3.66    2.51 (Sell)     6.81%
13     2008-12-19     2362     46.62     1.83     3.06    2.35 (Sell)     5.86%
14     2008-12-18     2547     43.67     1.50     3.21    2.22 (Sell)     -32.52%
15     2008-12-17     382     45.84     3.45     3.06    3.29 (Buy)     9.67%
16     2008-12-16     768     46.45     2.95     3.06    3.00 (Neutral)     0.67%
17     2008-12-15     366     42.31     2.81     3.21    2.98 (Sell)     1.71%
18     2008-12-12     605     38.98     2.72     3.21    2.93 (Sell)     -1.01%
19     2008-12-11     514     36.40     2.78     3.21    2.96 (Sell)     2.78%
20     2008-12-10     1400     36.44     2.63     3.21    2.88 (Sell)     2.49%

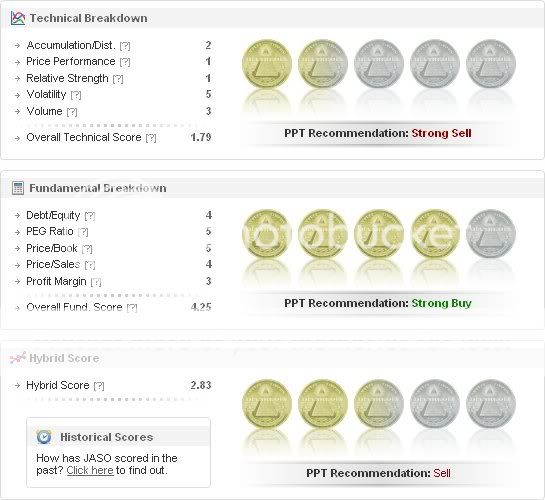
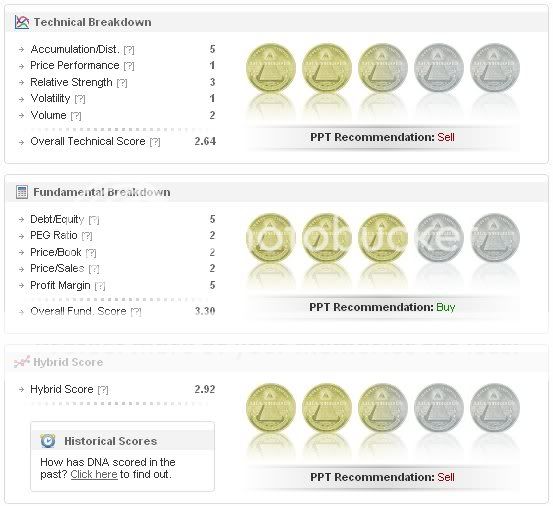
EN1GMA – SRS (no fundamental score – ETF), JASO

No.    Date    Close    Technicals
1     2009-01-09     58.5     2.49 Sell
2     2009-01-08     53.71     1.72 Strong Sell
3     2009-01-07     52.53     1.46 Strong Sell
4     2009-01-06     49.74     1.63 Strong Sell
5     2009-01-05     55.26     1.73 Strong Sell
6     2009-01-02     53.23     1.7 Strong Sell
7     2008-12-31     50.71     1.47 Strong Sell
8     2008-12-30     56.16     1.48 Strong Sell
9     2008-12-29     61.11     2.16 Sell
10     2008-12-26     55.5     1.15 Strong Sell
11     2008-12-24     56.65     1.8 Strong Sell
12     2008-12-23     57.3     1.85 Strong Sell
13     2008-12-19     54.34     2.19 Sell
14     2008-12-18     60.8     2.25 Sell
15     2008-12-17     52.89     1.78 Strong Sell
16     2008-12-16     57.1     1.76 Strong Sell
17     2008-12-15     75.56     2.12 Sell
18     2008-12-12     71.44     1.76 Strong Sell
19     2008-12-11     88.43     2.74 Sell
20     2008-12-10     70.95     2.22 Sell

No.    Date    Rank – Daily    Close    Technicals    Fundamentals    Hybrid Score    Hybrid Change
1     2009-01-09     437     4.66     1.79     4.25    2.83 (Sell)     3.66%
2     2009-01-08     1001     4.36     1.52     4.40    2.73 (Sell)     2.25%
3     2009-01-07     994     4.21     1.51     4.25    2.67 (Sell)     -11.88%
4     2009-01-06     1067     4.95     2.13     4.25    3.03 (Buy)     -10.88%
5     2009-01-05     409     5.09     2.78     4.25    3.40 (Buy)     1.19%
6     2009-01-02     588     4.84     2.70     4.25    3.36 (Buy)     -8.20%
7     2008-12-31     95     4.37     3.12     4.40    3.66 (Buy)     18.45%
8     2008-12-30         4.42     2.13     4.40    3.09 (Buy)     -1.28%
9     2008-12-29         3.43     2.21     4.40    3.13 (Buy)     22.75%
10     2008-12-26     666     3.25     1.20     4.40    2.55 (Sell)     0.00%
11     2008-12-24     956     3.21     1.45     4.40    2.69 (Sell)     -1.10%
12     2008-12-23     1109     3.40     1.50     4.40    2.72 (Sell)     -16.82%
13     2008-12-19     300     3.38     2.44     4.40    3.27 (Buy)     -6.57%
14     2008-12-18     128     3.38     2.85     4.40    3.50 (Buy)     3.55%
15     2008-12-17     259     3.46     2.43     4.70    3.38 (Buy)     17.77%
16     2008-12-16     1024     2.90     1.46     4.80    2.87 (Sell)     -3.04%
17     2008-12-15     394     2.95     1.62     4.80    2.96 (Sell)     -4.52%
18     2008-12-12     339     3.04     1.86     4.80    3.10 (Buy)     5.44%
19     2008-12-11     550     2.85     1.59     4.80    2.94 (Sell)     2.44%
20     2008-12-10     1441     2.85     1.47     4.80    2.87 (Sell)     -3.04%

Lerner – GS, MA

No.    Date    Rank – Daily    Close    Technicals    Fundamentals    Hybrid Score    Hybrid Change
1     2009-01-09     2207     83.88     1.04     3.68    2.15 (Sell)     0.47%
2     2009-01-08     2507     85.41     1.02     3.69    2.14 (Sell)     -9.70%
3     2009-01-07     1812     84.50     1.41     3.68    2.37 (Sell)     -5.95%
4     2009-01-06     2374     88.71     1.68     3.68    2.52 (Sell)     -12.20%
5     2009-01-05     1439     88.78     2.28     3.68    2.87 (Sell)     1.41%
6     2009-01-02     1845     86.76     2.20     3.69    2.83 (Sell)     -0.35%
7     2008-12-31     1640     84.39     2.22     3.69    2.84 (Sell)     5.19%
8     2008-12-30         82.06     2.03     3.62    2.70 (Sell)     25.00%
9     2008-12-29         76.56     1.11     3.62    2.16 (Sell)     0.00%
10     2008-12-26     1685     75.97     1.10     3.62    2.16 (Sell)     0.00%
11     2008-12-24     1968     76.44     1.35     3.62    2.30 (Sell)     -1.29%
12     2008-12-23     2065     75.20     1.40     3.62    2.33 (Sell)     -19.10%
13     2008-12-19     1035     80.73     2.34     3.62    2.88 (Sell)     9.09%
14     2008-12-18     1606     80.05     2.55     2.77    2.64 (Sell)     -5.38%
15     2008-12-17     1494     78.78     2.73     2.87    2.79 (Sell)     14.81%
16     2008-12-16     2087     76.00     2.11     2.87    2.43 (Sell)     24.62%
17     2008-12-15     2752     66.46     1.27     2.87    1.95 (Strong Sell)     -1.02%
18     2008-12-12     2856     67.74     1.31     2.87    1.97 (Strong Sell)     0.51%
19     2008-12-11     2790     69.71     1.29     2.87    1.96 (Strong Sell)     -2.00%
20     2008-12-10     3014     71.53     1.37     2.87    2.00 (Sell)     -12.66%

No.    Date    Rank – Daily    Close    Technicals    Fundamentals    Hybrid Score    Hybrid Change
1     2009-01-09     3101     149.77     1.29     2.12    1.64 (Strong Sell)     -5.75%
2     2009-01-08     3106     152.78     1.47     2.13    1.74 (Strong Sell)     -5.95%
3     2009-01-07     2952     152.07     1.66     2.12    1.85 (Strong Sell)     -19.57%
4     2009-01-06     2788     161.87     2.43     2.12    2.30 (Sell)     -2.54%
5     2009-01-05     2673     153.12     2.53     2.12    2.36 (Sell)     7.27%
6     2009-01-02     3017     149.64     2.25     2.12    2.20 (Sell)     -0.45%
7     2008-12-31     2861     142.80     2.27     2.12    2.21 (Sell)     45.39%
8     2008-12-30         138.96     1.08     2.11    1.52 (Strong Sell)     -2.56%
9     2008-12-29         139.21     1.16     2.11    1.56 (Strong Sell)     0.00%
10     2008-12-26     3096     140.80     1.15     2.11    1.56 (Strong Sell)     0.00%
11     2008-12-24     3119     142.10     1.40     2.11    1.70 (Strong Sell)     -1.73%
12     2008-12-23     3130     141.49     1.45     2.11    1.73 (Strong Sell)     -16.43%
13     2008-12-19     2851     152.20     2.04     2.11    2.07 (Sell)     -9.21%
14     2008-12-18     2432     148.67     2.40     2.11    2.28 (Sell)     6.05%
15     2008-12-17     2757     148.54     2.18     2.11    2.15 (Sell)     0.47%
16     2008-12-16     2599     147.96     2.16     2.11    2.14 (Sell)     18.89%
17     2008-12-15     3008     139.16     1.57     2.11    1.80 (Strong Sell)     7.14%
18     2008-12-12     3149     138.68     1.36     2.11    1.68 (Strong Sell)     0.60%
19     2008-12-11     3138     138.23     1.34     2.11    1.67 (Strong Sell)     -10.22%
20     2008-12-10     3111     144.87     1.67     2.11    1.86 (Strong Sell)     -16.59%

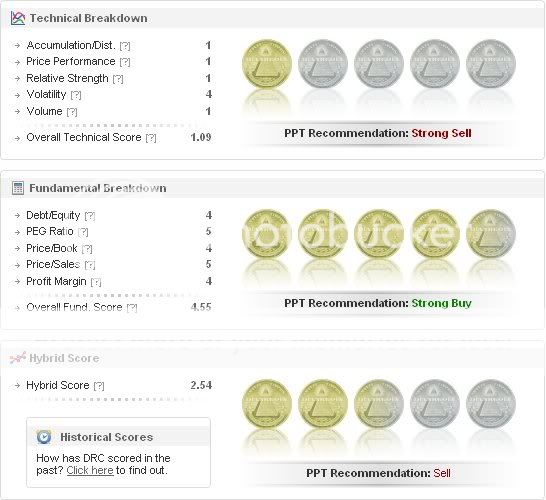
E8 – AIZ, KWK, DRC, MAN

No.    Date    Rank – Daily    Close    Technicals    Fundamentals    Hybrid Score    Hybrid Change
1     2009-01-09     1172     30.15     1.04     4.69    2.57 (Sell)     -16.56%
2     2009-01-08     311     30.81     1.92     4.69    3.08 (Buy)     15.36%
3     2009-01-07     980     29.91     1.21     4.69    2.67 (Sell)     -20.30%
4     2009-01-06     404     30.99     2.38     4.69    3.35 (Buy)     11.67%
5     2009-01-05     1127     29.77     1.78     4.69    3.00 (Neutral)     -7.69%
6     2009-01-02     864     30.24     2.20     4.70    3.25 (Buy)     -0.31%
7     2008-12-31     686     30.00     2.22     4.70    3.26 (Buy)     4.49%
8     2008-12-30         28.90     2.03     4.61    3.12 (Buy)     14.29%
9     2008-12-29         27.06     1.36     4.61    2.73 (Sell)     5.81%
10     2008-12-26     549     26.55     1.10     4.61    2.58 (Sell)     0.00%
11     2008-12-24     835     26.24     1.35     4.61    2.72 (Sell)     -1.09%
12     2008-12-23     1030     26.29     1.40     4.61    2.75 (Sell)     -22.10%
13     2008-12-19     104     27.74     2.74     4.61    3.53 (Buy)     6.97%
14     2008-12-18     278     26.42     2.35     4.61    3.30 (Buy)     10.00%
15     2008-12-17     971     25.10     1.83     4.61    3.00 (Neutral)     -5.06%
16     2008-12-16     482     25.75     2.11     4.61    3.16 (Buy)     13.26%
17     2008-12-15     739     21.81     1.47     4.61    2.79 (Sell)     -1.06%
18     2008-12-12     876     22.27     1.51     4.61    2.82 (Sell)     4.83%
19     2008-12-11     1125     22.07     1.29     4.61    2.69 (Sell)     -10.33%
20     2008-12-10     1093     22.93     1.82     4.61    3.00 (Neutral)     -8.54%

No.    Date    Rank – Daily    Close    Technicals    Fundamentals    Hybrid Score    Hybrid Change
1     2009-01-09     966     8.27     1.67     3.95    2.63 (Sell)     -10.54%
2     2009-01-08     427     8.52     2.20     3.95    2.94 (Sell)     8.89%
3     2009-01-07     971     8.55     1.80     3.95    2.70 (Sell)     -16.41%
4     2009-01-06     664     8.36     2.71     3.95    3.23 (Buy)     1.89%
5     2009-01-05     845     6.81     2.61     3.95    3.17 (Buy)     -4.52%
6     2009-01-02     682     6.21     2.75     4.10    3.32 (Buy)     12.93%
7     2008-12-31     1399     5.57     2.28     3.85    2.94 (Sell)     13.51%
8     2008-12-30         5.35     1.68     3.85    2.59 (Sell)     -4.78%
9     2008-12-29         5.17     1.90     3.85    2.72 (Sell)     18.26%
10     2008-12-26     1395     5.07     1.18     3.85    2.30 (Sell)     0.44%
11     2008-12-24     1773     4.99     1.32     3.85    2.39 (Sell)     -9.47%
12     2008-12-23     1337     5.11     1.76     3.85    2.64 (Sell)     -16.98%
13     2008-12-19     398     5.77     2.69     3.85    3.18 (Buy)     52.15%
14     2008-12-18     2806     5.30     0.81     3.85    2.09 (Sell)     -23.16%
15     2008-12-17     1673     5.66     1.89     3.85    2.72 (Sell)     3.82%
16     2008-12-16     1657     5.39     1.72     3.85    2.62 (Sell)     3.97%
17     2008-12-15     1488     5.10     1.55     3.85    2.52 (Sell)     -10.95%
18     2008-12-12     857     5.17     2.08     3.85    2.83 (Sell)     -15.02%
19     2008-12-11     157     5.27     2.94     3.85    3.33 (Buy)     -2.35%
20     2008-12-10     427     5.34     3.09     3.85    3.41 (Buy)     9.29%

No.    Date    Rank – Daily    Close    Technicals    Fundamentals    Hybrid Score    Hybrid Change
1     2009-01-09     1259     19.24     1.09     4.55    2.54 (Sell)     -16.72%
2     2009-01-08     344     19.74     1.97     4.55    3.05 (Buy)     5.17%
3     2009-01-07     505     19.35     1.71     4.55    2.90 (Sell)     -14.96%
4     2009-01-06     311     19.40     2.58     4.55    3.41 (Buy)     15.99%
5     2009-01-05     1264     18.50     1.78     4.55    2.94 (Sell)     -7.84%
6     2009-01-02     1025     18.77     2.20     4.55    3.19 (Buy)     -2.15%
7     2008-12-31     652     17.25     2.22     4.70    3.26 (Buy)     3.49%
8     2008-12-30         17.01     2.03     4.70    3.15 (Buy)     -1.25%
9     2008-12-29         16.37     2.11     4.70    3.19 (Buy)     22.22%
10     2008-12-26     466     16.33     1.10     4.70    2.61 (Sell)     0.00%
11     2008-12-24     745     15.75     1.35     4.70    2.75 (Sell)     -1.08%
12     2008-12-23     942     15.91     1.40     4.70    2.78 (Sell)     -6.71%
13     2008-12-19     740     16.42     1.74     4.70    2.98 (Sell)     -0.33%
14     2008-12-18     775     16.44     1.75     4.70    2.99 (Sell)     13.69%
15     2008-12-17     1852     17.15     1.13     4.70    2.63 (Sell)     -9.31%
16     2008-12-16     964     18.07     1.61     4.70    2.90 (Sell)     7.01%
17     2008-12-15     962     16.96     1.27     4.70    2.71 (Sell)     -5.57%
18     2008-12-12     761     17.44     1.56     4.70    2.87 (Sell)     0.35%
19     2008-12-11     693     17.59     1.54     4.70    2.86 (Sell)     -20.11%
20     2008-12-10     207     17.86     2.77     4.70    3.58 (Buy)     -0.56%

No.    Date    Rank – Daily    Close    Technicals    Fundamentals    Hybrid Score    Hybrid Change
1     2009-01-09     2204     33.11     1.44     3.11    2.15 (Sell)     0.94%
2     2009-01-08     2532     34.72     1.42     3.11    2.13 (Sell)     5.97%
3     2009-01-07     2698     33.74     1.21     3.11    2.01 (Sell)     -28.47%
4     2009-01-06     1582     35.73     2.58     3.11    2.81 (Sell)     14.23%
5     2009-01-05     2495     34.69     1.98     3.11    2.46 (Sell)     -5.02%
6     2009-01-02     2478     34.96     2.20     3.12    2.59 (Sell)     -0.38%
7     2008-12-31     2236     33.99     2.22     3.12    2.60 (Sell)     6.12%
8     2008-12-30         32.77     2.03     3.02    2.45 (Sell)     28.27%
9     2008-12-29         31.77     1.11     3.02    1.91 (Strong Sell)     0.00%
10     2008-12-26     2334     31.95     1.10     3.02    1.91 (Strong Sell)     0.00%
11     2008-12-24     2292     30.90     1.55     3.02    2.17 (Sell)     -6.06%
12     2008-12-23     2101     30.98     1.80     3.02    2.31 (Sell)     -22.48%
13     2008-12-19     743     36.40     2.94     3.02    2.98 (Sell)     8.36%
14     2008-12-18     1336     35.27     2.55     3.02    2.75 (Sell)     0.36%
15     2008-12-17     1623     35.10     2.53     3.02    2.74 (Sell)     0.37%
16     2008-12-16     1368     33.58     2.51     3.02    2.73 (Sell)     20.26%
17     2008-12-15     2067     31.52     1.72     3.02    2.27 (Sell)     -0.87%
18     2008-12-12     2218     32.65     1.76     3.02    2.29 (Sell)     7.51%
19     2008-12-11     2450     30.67     1.49     3.02    2.13 (Sell)     -12.70%
20     2008-12-10     2367     32.71     2.02     3.02    2.44 (Sell)     -9.63%

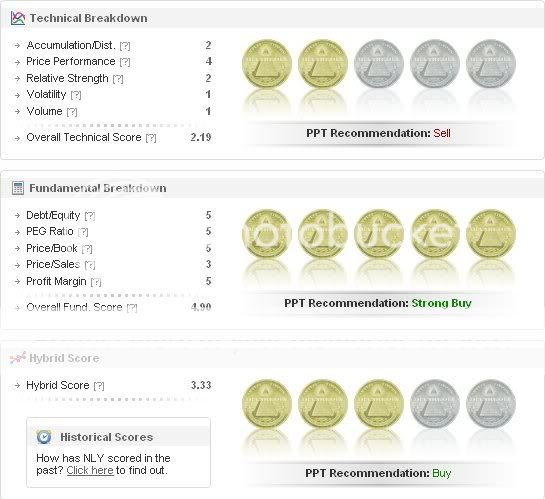
Sleepy – NLY, FMY (not in db), AIB, AWK

No.    Date    Rank – Daily    Close    Technicals    Fundamentals    Hybrid Score    Hybrid Change
1     2009-01-09     66     15.89     2.19     4.90    3.33 (Buy)     -13.95%
2     2009-01-08     20     15.97     3.12     4.90    3.87 (Buy)     12.83%
3     2009-01-07     57     15.76     2.36     4.90    3.43 (Buy)     -13.38%
4     2009-01-06     20     15.95     3.28     4.90    3.96 (Buy)     19.28%
5     2009-01-05     560     15.34     2.18     4.90    3.32 (Buy)     1.22%
6     2009-01-02     772     15.27     2.10     4.90    3.28 (Buy)     -15.25%
7     2008-12-31     50     15.87     3.12     4.90    3.87 (Buy)     24.44%
8     2008-12-30         15.29     1.93     4.73    3.11 (Buy)     -1.58%
9     2008-12-29         15.00     2.01     4.73    3.16 (Buy)     -4.24%
10     2008-12-26     20     15.71     2.25     4.73    3.30 (Buy)     -11.53%
11     2008-12-24     6     15.59     3.25     4.73    3.88 (Buy)     -3.48%
12     2008-12-23     8     15.62     3.50     4.73    4.02 (Strong Buy)     14.20%
13     2008-12-19     115     15.20     2.64     4.73    3.52 (Buy)     -0.28%
14     2008-12-18     110     14.48     2.65     4.73    3.53 (Buy)     -13.90%
15     2008-12-17     11     15.40     3.63     4.73    4.10 (Strong Buy)     6.49%
16     2008-12-16     18     15.35     3.21     4.73    3.85 (Buy)     2.12%
17     2008-12-15     8     14.20     3.07     4.73    3.77 (Buy)     8.65%
18     2008-12-12     79     14.46     2.56     4.73    3.47 (Buy)     2.66%
19     2008-12-11     141     13.25     2.39     4.73    3.38 (Buy)     -8.15%
20     2008-12-10     117     14.42     2.92     4.73    3.68 (Buy)     0.00%

No.    Date    Rank – Daily    Close    Technicals    Fundamentals    Hybrid Score    Hybrid Change
1     2009-01-09     109     5.44     2.29     4.50    3.22 (Buy)     -3.01%
2     2009-01-08     117     5.38     2.47     4.50    3.32 (Buy)     19.86%
3     2009-01-07     732     5.10     1.51     4.50    2.77 (Sell)     -16.06%
4     2009-01-06     519     4.97     2.43     4.50    3.30 (Buy)     18.71%
5     2009-01-05     1678     4.77     1.53     4.50    2.78 (Sell)     -18.95%
6     2009-01-02     449     4.84     2.65     4.50    3.43 (Buy)     17.06%
7     2008-12-31     1449     4.69     1.97     4.25    2.93 (Sell)     24.68%
8     2008-12-30         4.71     1.08     4.09    2.35 (Sell)     -1.67%
9     2008-12-29         4.59     1.16     4.09    2.39 (Sell)     0.00%
10     2008-12-26     1162     4.72     1.15     4.09    2.39 (Sell)     0.00%
11     2008-12-24     1450     4.80     1.40     4.09    2.53 (Sell)     -13.06%
12     2008-12-23     561     4.89     2.05     4.09    2.91 (Sell)     5.43%
13     2008-12-19     1363     4.59     1.79     4.09    2.76 (Sell)     9.09%
14     2008-12-18     1869     4.93     1.40     4.09    2.53 (Sell)     -4.17%
15     2008-12-17     1831     5.33     1.58     4.09    2.64 (Sell)     -14.56%
16     2008-12-16     621     5.77     2.36     4.09    3.09 (Buy)     24.10%
17     2008-12-15     1574     5.33     1.32     4.09    2.49 (Sell)     -0.80%
18     2008-12-12     1718     5.35     1.36     4.09    2.51 (Sell)     0.40%
19     2008-12-11     1621     5.48     1.34     4.09    2.50 (Sell)     -19.87%
20     2008-12-10     831     5.91     2.42     4.09    3.12 (Buy)     -2.50%

No.    Date    Rank – Daily    Close    Technicals    Fundamentals    Hybrid Score    Hybrid Change
1     2009-01-09     1200     20.71     2.49     2.66    2.56 (Sell)     29.29%
2     2009-01-08     2811     20.19     1.47     2.70    1.98 (Strong Sell)     0.51%
3     2009-01-07     2760     20.02     1.46     2.66    1.97 (Strong Sell)     -4.83%
4     2009-01-06     3005     20.49     1.63     2.66    2.07 (Sell)     -4.17%
5     2009-01-05     2927     20.49     1.78     2.70    2.16 (Sell)     -9.24%
6     2009-01-02     2812     21.12     2.15     2.70    2.38 (Sell)     -8.11%
7     2008-12-31     2246     20.88     2.52     2.70    2.59 (Sell)     28.86%
8     2008-12-30         19.75     1.73     2.41    2.01 (Sell)     -15.55%
9     2008-12-29         20.94     2.36     2.41    2.38 (Sell)     14.42%
10     2008-12-26     1859     21.78     1.85     2.41    2.08 (Sell)     -21.80%
11     2008-12-24     196     21.92     3.55     2.41    3.07 (Buy)     -12.29%
12     2008-12-23     67     22.16     4.30     2.41    3.50 (Buy)     59.82%
13     2008-12-19     2657     21.09     2.04     2.41    2.19 (Sell)     -20.36%
14     2008-12-18     1323     20.74     3.00     2.41    2.75 (Sell)     -17.91%
15     2008-12-17     290     21.82     4.03     2.41    3.35 (Buy)     13.18%
16     2008-12-16     843     20.94     3.36     2.41    2.96 (Sell)     12.98%
17     2008-12-15     1244     20.64     2.77     2.41    2.62 (Sell)     0.38%
18     2008-12-12     1495     20.41     2.76     2.41    2.61 (Sell)     5.24%
19     2008-12-11     1664     20.70     2.54     2.41    2.48 (Sell)     -11.11%
20     2008-12-10     1619     20.67     3.07     2.41    2.79 (Sell)     -8.52%

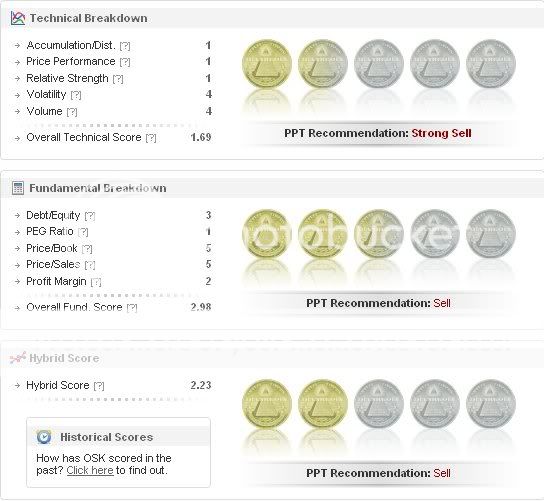
FastEddie – OSK

No.    Date    Rank – Daily    Close    Technicals    Fundamentals    Hybrid Score    Hybrid Change
1     2009-01-09     2007     11.32     1.69     2.98    2.23 (Sell)     -0.89%
2     2009-01-08     2277     11.45     1.72     2.97    2.25 (Sell)     -19.35%
3     2009-01-07     697     11.94     2.66     2.97    2.79 (Sell)     -7.31%
4     2009-01-06     1099     12.00     3.03     2.98    3.01 (Buy)     5.99%
5     2009-01-05     1519     11.33     2.73     3.00    2.84 (Sell)     5.97%
6     2009-01-02     2252     10.30     2.45     3.00    2.68 (Sell)     3.47%
7     2008-12-31     2259     8.89     2.47     2.75    2.59 (Sell)     13.10%
8     2008-12-30         8.29     2.08     2.56    2.29 (Sell)     30.86%
9     2008-12-29         7.64     1.16     2.56    1.75 (Strong Sell)     0.00%
10     2008-12-26     2761     7.94     1.15     2.56    1.75 (Strong Sell)     0.00%
11     2008-12-24     2913     7.84     1.40     2.56    1.89 (Strong Sell)     -7.35%
12     2008-12-23     2750     7.66     1.65     2.56    2.04 (Sell)     2.00%
13     2008-12-19     2963     8.44     1.59     2.56    2.00 (Sell)     -6.98%
14     2008-12-18     2694     8.59     1.85     2.56    2.15 (Sell)     -12.60%
15     2008-12-17     2246     9.07     2.38     2.56    2.46 (Sell)     5.58%
16     2008-12-16     2269     8.41     2.16     2.56    2.33 (Sell)     17.09%
17     2008-12-15     2675     7.83     1.57     2.56    1.99 (Strong Sell)     -1.00%
18     2008-12-12     2787     8.04     1.61     2.56    2.01 (Sell)     2.03%
19     2008-12-11     2778     7.56     1.54     2.56    1.97 (Strong Sell)     -24.23%
20     2008-12-10     2037     7.90     2.62     2.56    2.60 (Sell)     1.56%

Comments »

The PPT: The Other 1% (PLUS: Initial Requests ADDED)

I’m probably the only blogger that didn’t put up a post on The PPT yet, so here goes. This review is entirely my own opinion of The PPT. 99% of trading products that are sold are total scams or simply do not work. This post is in response to the people who think The PPT is part of that 99%. Let it be known that The PPT is the other 1%. I endorse it and here’s why:

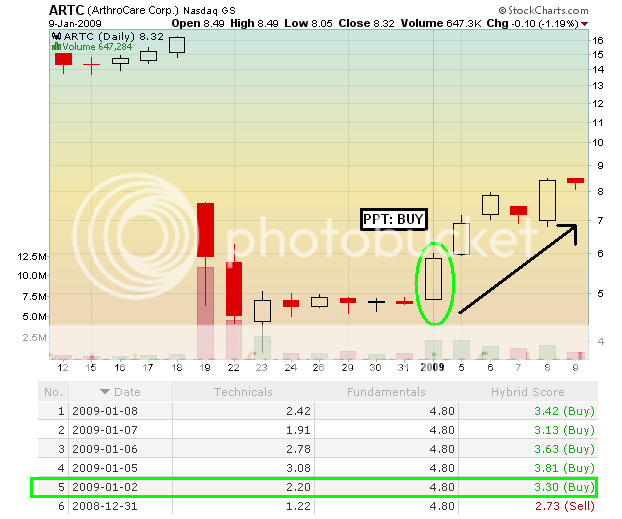
My absolute favorite feature on The PPT is the extremely accurate entry & exit signals. Don’t believe me? I decided to run some of my top spiker trades of last week (FTK, ARTC, APL, GFIG, AER, GLS, MEA) through The PPT‘s Historical Scores function, and here are the no-bullshit results:

———————————————————

Let’s do a quick and random scan:

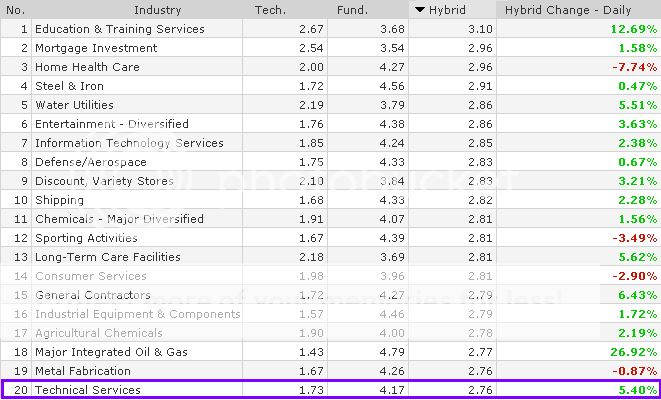
Let’s say I want to see the top 20 industries right now.

We all know “Education & Training Servcies” is #1 because Gio made more than enough coin to go into the weekend very satisfied.

But, let’s consider #20, which is “Technical Services”.

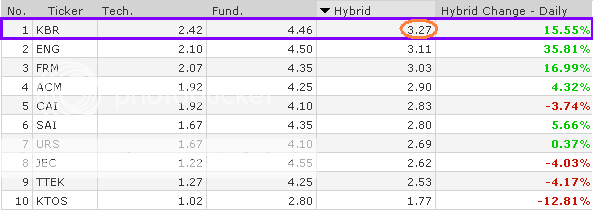
Here are the industry’s components:

I sorted the screen so that the stock with the top hybrid score came up. It was KBR with a 3.27.

A summary shows that The PPT recommends KBR as a “BUY“:

Like I said, my favorite function is the ability to look up a stock’s historical PPT scores. As a technical trader, I base my decisions on trends and looking at a stock’s scoring trend on The PPT is no different:

We can see that the initial “BUY” signal came on 12/30/2008 with a 3.03. The score steadily improved since then. A “SELL” signal came on 1/07/2009 with a 2.83. A “BUY” signal came shortly after the next day.

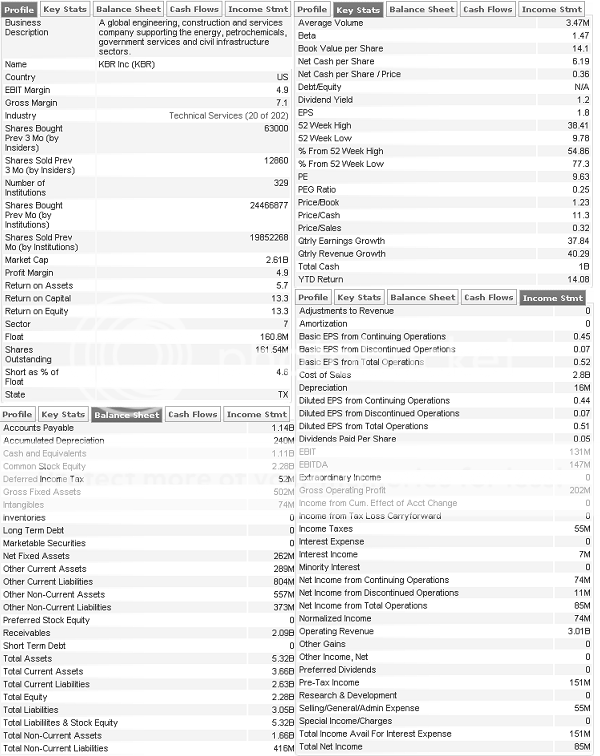
There is also a boatload of fundamentals for all of you people that are good at math:

This is why The PPT is the other 1%. I can’t think of any other program that comes close. I googled “stock trading programs” and there were 726,000 hits, no doubt the vast majority of them being junk. You’re looking at a fucking time machine here.

There is a lot of interest for individual PPT scans. To make it easier for the rest of the bloggers, I will honor any PPT requests. Make sure they are not duplicates that Gio is working on.

Here’s how to order: Leave a comment with your picks and I’ll get you the summary and historical scores.

Limit two (2) per person, but if you order now, I’ll double the offer!

We can’t do this all day. Offer ends on midnight.

———————————————————

PERSONAL REQUESTS:

BG – XLF (no fundamental score)

No.    Date    Close    Technicals
1     2009-01-08     11.94     1.22 Strong Sell
2     2009-01-07     11.99     1.21 Strong Sell
3     2009-01-06     12.65     1.43 Strong Sell
4     2009-01-05     12.45     1.53 Strong Sell
5     2009-01-02     12.66     2.2 Sell
6     2008-12-31     12.52     2.22 Sell
7     2008-12-30     12.13     2.03 Sell
8     2008-12-29     11.68     1.11 Strong Sell
9     2008-12-26     11.78     1.1 Strong Sell
10     2008-12-24     11.77     1.35 Strong Sell
11     2008-12-23     11.52     1.4 Strong Sell
12     2008-12-19     12.23     1.54 Strong Sell
13     2008-12-18     12.26     1.8 Strong Sell
14     2008-12-17     12.62     2.13 Sell
15     2008-12-16     12.74     2.11 Sell
16     2008-12-15     11.46     1.27 Strong Sell
17     2008-12-12     11.95     1.51 Strong Sell
18     2008-12-11     11.72     1.49 Strong Sell
19     2008-12-10     12.7     2.02 Sell
20     2008-12-09     12.93     2.26 Sell

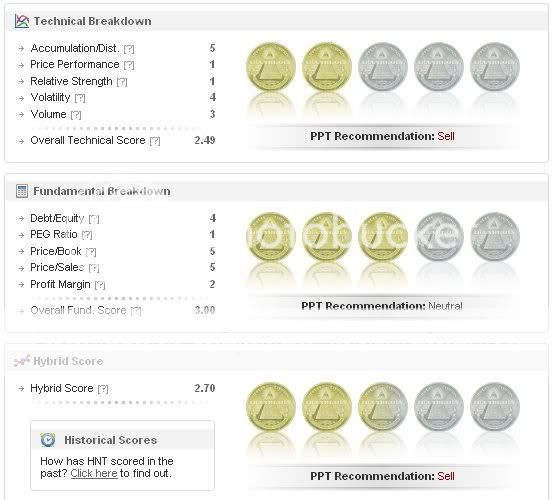
1Option – DNA, HNT

No.    Date    Rank – Daily    Close    Technicals    Fundamentals    Hybrid Score    Hybrid Change
1     2009-01-08     1411     84.40     2.07     3.30    2.59 (Sell)     -14.24%
2     2009-01-07     290     84.53     2.81     3.30    3.02 (Buy)     0.67%
3     2009-01-06     1144     84.00     2.78     3.30    3.00 (Neutral)     2.04%
4     2009-01-05     1277     83.00     2.68     3.30    2.94 (Sell)     19.51%
5     2009-01-02     2677     82.60     1.85     3.30    2.46 (Sell)     -15.46%
6     2008-12-31     1492     82.91     2.62     3.30    2.91 (Sell)     23.31%
7     2008-12-30         82.28     1.68     3.30    2.36 (Sell)     3.96%
8     2008-12-29         81.97     1.51     3.30    2.27 (Sell)     15.23%
9     2008-12-26     2190     82.21     1.00     3.30    1.97 (Strong Sell)     -12.83%
10     2008-12-24     1417     82.80     2.00     3.30    2.55 (Sell)     -5.56%
11     2008-12-23     1147     83.00     2.25     3.30    2.70 (Sell)     -15.89%
12     2008-12-19         83.75     3.14     3.30    0.00 (Strong Sell)     0.00%
13     2008-12-18         80.30     2.95     3.30    0.00 (Strong Sell)     0.00%
14     2008-12-17         78.75     2.48     3.30    0.00 (Strong Sell)     0.00%
15     2008-12-16         77.59     1.51     1.90    0.00 (Strong Sell)     0.00%

No.    Date    Rank – Daily    Close    Technicals    Fundamentals    Hybrid Score    Hybrid Change
1     2009-01-08     525     13.71     2.87     3.00    2.92 (Sell)     8.55%
2     2009-01-07     944     13.38     2.46     3.00    2.69 (Sell)     -3.58%
3     2009-01-06     1638     12.70     2.63     3.00    2.79 (Sell)     6.90%
4     2009-01-05     2112     12.05     2.33     3.00    2.61 (Sell)     1.56%
5     2009-01-02     2524     11.43     2.25     3.00    2.57 (Sell)     1.18%
6     2008-12-31     2366     10.89     2.27     2.90    2.54 (Sell)     5.83%
7     2008-12-30         11.00     2.03     2.90    2.40 (Sell)     29.03%
8     2008-12-29         10.49     1.11     2.90    1.86 (Strong Sell)     0.00%
9     2008-12-26     2502     10.75     1.10     2.90    1.86 (Strong Sell)     -7.00%
10     2008-12-24     2703     10.71     1.35     2.90    2.00 (Sell)     -1.48%
11     2008-12-23     2773     10.54     1.40     2.90    2.03 (Sell)     -5.14%
12     2008-12-19     2747     10.73     1.59     2.90    2.14 (Sell)     -1.83%
13     2008-12-18     2630     10.87     1.65     2.90    2.18 (Sell)     0.46%
14     2008-12-17     2726     10.77     1.63     2.90    2.17 (Sell)     -12.15%
15     2008-12-16     2009     11.04     2.16     2.90    2.47 (Sell)     15.96%
16     2008-12-15     2378     10.41     1.57     2.90    2.13 (Sell)     -7.39%
17     2008-12-12     2199     10.49     1.86     2.90    2.30 (Sell)     0.44%
18     2008-12-11     2078     10.31     1.84     2.90    2.29 (Sell)     4.57%
19     2008-12-10     2803     10.19     1.67     2.90    2.19 (Sell)     -11.34%
20     2008-12-09     2498     10.01     2.16     2.90    2.47 (Sell)     -13.94%

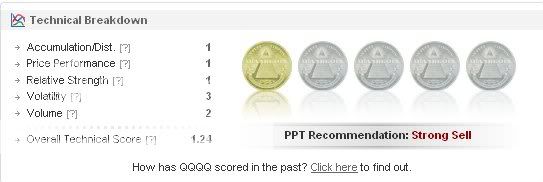
Private Parts – SPY, QQQQ (no funamental scores), FAZ (not enough data for price scoring)

No.    Date    Close    Technicals
1     2009-01-08     91.04     1.47 Strong Sell
2     2009-01-07     90.67     1.46 Strong Sell
3     2009-01-06     93.47     2.43 Sell
4     2009-01-05     92.85     2.53 Sell
5     2009-01-02     92.96     2.45 Sell
6     2008-12-31     90.24     2.47 Sell
7     2008-12-30     88.97     2.28 Sell
8     2008-12-29     86.91     1.36 Strong Sell
9     2008-12-26     87.16     1.1 Strong Sell
10     2008-12-24     86.66     1.35 Strong Sell
11     2008-12-23     86.16     1.4 Strong Sell
12     2008-12-19     88.19     1.54 Strong Sell
13     2008-12-18     88.57     1.85 Strong Sell
14     2008-12-17     90.26     2.38 Sell
15     2008-12-16     91.14     2.36 Sell
16     2008-12-15     87.04     1.47 Strong Sell
17     2008-12-12     88.27     1.51 Strong Sell
18     2008-12-11     87.23     1.49 Strong Sell
19     2008-12-10     89.38     2.07 Sell
20     2008-12-09     88.78     2.06 Sell

No.    Date    Close    Technicals
1     2009-01-08     30.76     1.47 Strong Sell
2     2009-01-07     30.44     1.46 Strong Sell
3     2009-01-06     31.33     2.43 Sell
4     2009-01-05     31.02     2.53 Sell
5     2009-01-02     31.03     2.45 Sell
6     2008-12-31     29.74     2.22 Sell
7     2008-12-30     29.49     2.03 Sell
8     2008-12-29     28.89     1.11 Strong Sell
9     2008-12-26     29.13     1.1 Strong Sell
10     2008-12-24     29.14     1.35 Strong Sell
11     2008-12-23     29.06     1.4 Strong Sell
12     2008-12-19     29.86     1.34 Strong Sell
13     2008-12-18     29.62     1.8 Strong Sell
14     2008-12-17     30.15     2.13 Sell
15     2008-12-16     30.52     2.11 Sell
16     2008-12-15     29.12     1.47 Strong Sell
17     2008-12-12     29.64     1.51 Strong Sell
18     2008-12-11     29.05     1.49 Strong Sell
19     2008-12-10     29.87     2.07 Sell
20     2008-12-09     29.97     2.81 Sell

Larry Flint – PAAS (not in db yet), GE

No.    Date    Rank – Daily    Close    Technicals    Fundamentals    Hybrid Score    Hybrid Change
1     2009-01-08     2506     16.14     1.30     3.30    2.14 (Sell)     5.94%
2     2009-01-07     2669     16.11     1.08     3.30    2.02 (Sell)     -8.18%
3     2009-01-06     2917     16.86     1.40     3.30    2.20 (Sell)     -2.22%
4     2009-01-05     2817     16.63     1.48     3.30    2.25 (Sell)     -13.79%
5     2009-01-02     2429     17.07     2.10     3.30    2.61 (Sell)     1.95%
6     2008-12-31     2309     16.20     2.20     3.05    2.56 (Sell)     30.61%
7     2008-12-30         15.82     1.30     2.87    1.96 (Strong Sell)     5.95%
8     2008-12-29         15.66     1.11     2.87    1.85 (Strong Sell)     0.00%
9     2008-12-26     2522     15.97     1.10     2.87    1.85 (Strong Sell)     0.00%
10     2008-12-24     2701     16.11     1.36     2.87    2.00 (Sell)     0.00%
11     2008-12-23     2831     16.12     1.36     2.87    2.00 (Sell)     -9.91%
12     2008-12-19     2612     16.19     1.74     2.87    2.22 (Sell)     8.29%
13     2008-12-18     2858     15.66     1.44     2.87    2.05 (Sell)     -5.53%
14     2008-12-17     2725     17.06     1.66     2.87    2.17 (Sell)     -13.20%
15     2008-12-16     1932     17.58     2.23     2.87    2.50 (Sell)     27.55%
16     2008-12-15     2734     16.63     1.29     2.87    1.96 (Strong Sell)     -1.51%
17     2008-12-12     2816     16.79     1.35     2.87    1.99 (Strong Sell)     0.00%
18     2008-12-11     2736     16.73     1.34     2.87    1.99 (Strong Sell)     -5.24%
19     2008-12-10     2909     17.66     1.54     2.87    2.10 (Sell)     -10.64%
20     2008-12-09     2700     17.44     1.96     2.87    2.35 (Sell)     -20.34%

Anj – SAY (fyi – nothing protects against fraud)

No.    Date    Rank – Daily    Close    Technicals    Fundamentals    Hybrid Score    Hybrid Change
1     2009-01-08     153     9.35     2.02     4.99    3.27 (Buy)     0.00%
2     2009-01-07     111     9.35     2.01     4.99    3.27 (Buy)     -2.68%
3     2009-01-06     400     9.35     2.18     4.99    3.36 (Buy)     18.31%
4     2009-01-05     1525     8.99     1.28     4.99    2.84 (Sell)     -8.09%
5     2009-01-02     1256     8.98     1.70     5.00    3.09 (Buy)     -8.85%
6     2008-12-31     375     9.04     2.22     5.00    3.39 (Buy)     1.19%
7     2008-12-30         8.75     2.23     4.90    3.35 (Buy)     2.13%
8     2008-12-29         8.41     2.11     4.90    3.28 (Buy)     -3.24%
9     2008-12-26     15     7.92     2.30     4.90    3.39 (Buy)     14.53%
10     2008-12-24     95     7.63     2.20     4.90    3.34 (Buy)     11.71%
11     2008-12-23     378     7.35     1.60     4.90    2.99 (Sell)     -10.21%
12     2008-12-19     251     7.83     2.19     4.90    3.33 (Buy)     1.52%
13     2008-12-18     309     8.22     2.10     4.90    3.28 (Buy)     3.14%
14     2008-12-17     620     8.55     1.93     4.90    3.18 (Buy)     17.78%
15     2008-12-16     1448     5.70     1.11     4.90    2.70 (Sell)     1.50%
16     2008-12-15     1098     12.55     1.47     4.30    2.66 (Sell)     -24.00%
17     2008-12-12     68     12.66     2.71     4.60    3.50 (Buy)     22.38%
18     2008-12-11     709     12.22     1.49     4.75    2.86 (Sell)     -6.54%
19     2008-12-10     975     12.21     1.82     4.75    3.06 (Buy)     -7.55%
20     2008-12-09     617     12.15     2.26     4.75    3.31 (Buy)     2.16%

Braveflaps – DRYS

No.    Date    Rank – Daily    Close    Technicals    Fundamentals    Hybrid Score    Hybrid Change
1     2009-01-08     54     15.13     2.52     4.90    3.52 (Buy)     19.73%
2     2009-01-07     387     12.96     1.51     4.90    2.94 (Sell)     -21.18%
3     2009-01-06     54     15.23     2.88     4.90    3.73 (Buy)     1.63%
4     2009-01-05     98     13.85     2.78     4.90    3.67 (Buy)     4.56%
5     2009-01-02     315     12.49     2.50     4.90    3.51 (Buy)     6.36%
6     2008-12-31     566     10.66     2.32     4.65    3.30 (Buy)     23.60%
7     2008-12-30         9.62     1.38     4.46    2.67 (Sell)     3.89%
8     2008-12-29         8.99     1.21     4.46    2.57 (Sell)     0.00%
9     2008-12-26     582     9.69     1.20     4.46    2.57 (Sell)     0.00%
10     2008-12-24     869     9.49     1.45     4.46    2.71 (Sell)     -8.75%
11     2008-12-23     424     9.59     1.90     4.46    2.97 (Sell)     1.02%
12     2008-12-19     840     11.23     1.84     4.46    2.94 (Sell)     -19.23%
13     2008-12-18     67     12.28     3.05     4.46    3.64 (Buy)     7.06%
14     2008-12-17     233     12.43     2.63     4.46    3.40 (Buy)     -6.08%
15     2008-12-16     44     11.13     3.01     4.46    3.62 (Buy)     10.70%
16     2008-12-15     119     10.19     2.42     4.46    3.27 (Buy)     7.57%
17     2008-12-12     408     9.37     2.01     4.46    3.04 (Buy)     -7.60%
18     2008-12-11     180     8.86     2.44     4.46    3.29 (Buy)     -12.73%
19     2008-12-10     62     10.71     3.27     4.46    3.77 (Buy)     -3.58%
20     2008-12-09     35     9.45     3.51     4.46    3.91 (Buy)     3.44%

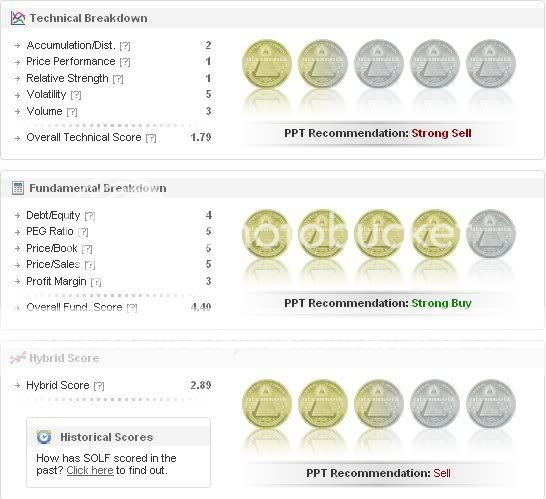
JJ – LDK, ESRX, AVAV, SOLF

No.    Date    Rank – Daily    Close    Technicals    Fundamentals    Hybrid Score    Hybrid Change
1     2009-01-08     901     14.50     1.57     4.40    2.76 (Sell)     -8.61%
2     2009-01-07     287     13.78     1.91     4.55    3.02 (Buy)     -11.18%
3     2009-01-06     330     14.99     2.68     4.40    3.40 (Buy)     1.49%
4     2009-01-05     505     14.84     2.58     4.40    3.35 (Buy)     3.40%
5     2009-01-02     884     13.97     2.30     4.55    3.24 (Buy)     14.89%
6     2008-12-31     1690     13.12     1.57     4.55    2.82 (Sell)     -10.48%
7     2008-12-30         13.50     2.13     4.55    3.15 (Buy)     20.69%
8     2008-12-29         12.67     1.21     4.55    2.61 (Sell)     0.00%
9     2008-12-26     474     12.52     1.20     4.55    2.61 (Sell)     0.00%
10     2008-12-24     752     12.39     1.45     4.55    2.75 (Sell)     -1.08%
11     2008-12-23     931     12.80     1.50     4.55    2.78 (Sell)     -5.76%
12     2008-12-19     826     13.90     1.89     4.40    2.95 (Sell)     -1.01%
13     2008-12-18     806     12.95     1.85     4.55    2.98 (Sell)     -8.59%
14     2008-12-17     448     14.79     2.43     4.40    3.26 (Buy)     2.19%
15     2008-12-16     435     13.25     2.21     4.55    3.19 (Buy)     18.15%
16     2008-12-15     988     12.03     1.37     4.55    2.70 (Sell)     -5.92%
17     2008-12-12     767     12.64     1.66     4.55    2.87 (Sell)     1.41%
18     2008-12-11     766     12.13     1.59     4.55    2.83 (Sell)     -5.35%
19     2008-12-10     1127     11.79     1.87     4.55    2.99 (Sell)     -4.47%
20     2008-12-09     1007     11.69     2.11     4.55    3.13 (Buy)     7.93%

No.    Date    Rank – Daily    Close    Technicals    Fundamentals    Hybrid Score    Hybrid Change
1     2009-01-08     1396     55.50     1.67     3.85    2.59 (Sell)     4.86%
2     2009-01-07     1556     55.68     1.46     3.85    2.47 (Sell)     -21.59%
3     2009-01-06     811     57.33     2.63     3.85    3.15 (Buy)     13.72%
4     2009-01-05     1703     57.12     1.98     3.85    2.77 (Sell)     2.97%
5     2009-01-02     2240     56.69     1.85     3.85    2.69 (Sell)     3.86%
6     2008-12-31     2253     54.98     1.67     3.85    2.59 (Sell)     9.75%
7     2008-12-30         57.36     1.28     3.85    2.36 (Sell)     -2.07%
8     2008-12-29         58.43     1.36     3.85    2.41 (Sell)     6.64%
9     2008-12-26     1491     59.21     1.10     3.85    2.26 (Sell)     -5.83%
10     2008-12-24     1395     58.21     1.60     3.85    2.55 (Sell)     -1.16%
11     2008-12-23     1512     59.07     1.65     3.85    2.58 (Sell)     -20.37%
12     2008-12-19     320     61.35     2.79     3.85    3.24 (Buy)     15.30%
13     2008-12-18     1195     59.35     2.05     3.85    2.81 (Sell)     0.36%
14     2008-12-17     1471     59.41     2.03     3.85    2.80 (Sell)     -13.04%
15     2008-12-16     375     61.36     2.76     3.85    3.22 (Buy)     21.51%
16     2008-12-15     1145     58.80     1.77     3.85    2.65 (Sell)     5.16%
17     2008-12-12     1699     57.48     1.56     3.85    2.52 (Sell)     0.40%
18     2008-12-11     1603     57.72     1.54     3.85    2.51 (Sell)     -7.04%
19     2008-12-10     1805     59.08     1.87     3.85    2.70 (Sell)     -8.78%
20     2008-12-09     1420     58.01     2.31     3.85    2.96 (Sell)     -9.48%

No.    Date    Rank – Daily    Close    Technicals    Fundamentals    Hybrid Score    Hybrid Change
1     2009-01-08     48     36.89     3.22     4.05    3.57 (Buy)     3.48%
2     2009-01-07     49     36.75     3.01     4.05    3.45 (Buy)     -9.92%
3     2009-01-06     28     37.78     3.68     4.05    3.83 (Buy)     -11.55%
4     2009-01-05     4     39.38     4.53     4.05    4.33 (Strong Buy)     3.84%
5     2009-01-02     14     38.26     4.25     4.05    4.17 (Strong Buy)     2.71%
6     2008-12-31     27     36.81     4.07     4.05    4.06 (Strong Buy)     4.91%
7     2008-12-30         35.41     3.63     4.20    3.87 (Buy)     20.19%
8     2008-12-29         34.40     2.51     4.20    3.22 (Buy)     4.89%
9     2008-12-26     59     32.89     2.25     4.20    3.07 (Buy)     0.00%
10     2008-12-24     79     32.82     2.75     4.20    3.36 (Buy)     3.70%
11     2008-12-23     155     33.78     2.55     4.20    3.24 (Buy)     -11.72%
12     2008-12-19     50     34.00     3.29     4.20    3.67 (Buy)     -11.99%
13     2008-12-18     6     36.00     4.15     4.20    4.17 (Strong Buy)     3.22%
14     2008-12-17     14     34.81     3.93     4.20    4.04 (Strong Buy)     21.32%
15     2008-12-16     222     34.05     2.71     4.20    3.33 (Buy)     -8.26%
16     2008-12-15     23     33.58     3.22     4.20    3.63 (Buy)     6.14%
17     2008-12-12     103     34.28     2.86     4.20    3.42 (Buy)     -6.04%
18     2008-12-11     28     33.00     3.24     4.20    3.64 (Buy)     -4.21%
19     2008-12-10     46     34.78     3.52     4.20    3.80 (Buy)     0.80%
20     2008-12-09     83     33.50     3.46     4.20    3.77 (Buy)     13.55%

No.    Date    Rank – Daily    Close    Technicals    Fundamentals    Hybrid Score    Hybrid Change
1     2009-01-08     1680     5.77     1.12     4.40    2.50 (Sell)     -15.54%
2     2009-01-07     360     5.32     1.91     4.40    2.96 (Sell)     -4.21%
3     2009-01-06     957     5.85     2.13     4.40    3.09 (Buy)     -5.21%
4     2009-01-05     673     6.12     2.58     4.20    3.26 (Buy)     12.80%
5     2009-01-02     1697     5.40     1.95     4.20    2.89 (Sell)     6.64%
6     2008-12-31     1999     5.01     1.77     4.00    2.71 (Sell)     -7.19%
7     2008-12-30         5.25     2.13     4.00    2.92 (Sell)     15.42%
8     2008-12-29         4.80     1.46     4.00    2.53 (Sell)     6.30%
9     2008-12-26     1202     4.79     1.20     4.00    2.38 (Sell)     0.00%
10     2008-12-24     1485     4.66     1.45     4.00    2.52 (Sell)     -1.18%
11     2008-12-23     1570     4.79     1.50     4.00    2.55 (Sell)     1.19%
12     2008-12-19     2027     4.99     1.44     4.00    2.52 (Sell)     -8.36%
13     2008-12-18     1346     4.78     1.85     4.00    2.75 (Sell)     -7.41%
14     2008-12-17     1056     5.14     2.23     4.00    2.97 (Sell)     24.79%
15     2008-12-16     2183     4.79     1.21     4.00    2.38 (Sell)     -3.64%
16     2008-12-15     1596     4.74     1.37     4.00    2.47 (Sell)     -5.36%
17     2008-12-12     1512     4.71     1.61     4.00    2.61 (Sell)     4.82%
18     2008-12-11     1658     4.70     1.39     4.00    2.49 (Sell)     -7.09%
19     2008-12-10     1861     4.90     1.72     4.00    2.68 (Sell)     0.37%
20     2008-12-09     2107     4.69     1.71     4.00    2.67 (Sell)     -4.98%

Leonard – AZO

No.    Date    Rank – Daily    Close    Technicals    Fundamentals    Hybrid Score    Hybrid Change
1     2009-01-08     1099     135.86     2.07     3.55    2.69 (Sell)     -10.33%
2     2009-01-07     308     135.44     2.61     3.55    3.00 (Neutral)     -7.69%
3     2009-01-06     622     139.20     3.03     3.55    3.25 (Buy)     -2.40%
4     2009-01-05     532     137.73     3.18     3.55    3.33 (Buy)     -10.48%
5     2009-01-02     117     140.57     3.85     3.55    3.72 (Buy)     -3.38%
6     2008-12-31     54     139.47     4.07     3.55    3.85 (Buy)     20.69%
7     2008-12-30         137.25     2.93     3.55    3.19 (Buy)     13.93%
8     2008-12-29         132.69     2.26     3.55    2.80 (Sell)     -13.04%
9     2008-12-26     30     132.23     2.75     3.85    3.22 (Buy)     9.90%
10     2008-12-24     648     129.97     2.00     3.85    2.78 (Sell)     -8.55%
11     2008-12-23     307     129.71     2.45     3.85    3.04 (Buy)     -5.30%
12     2008-12-19     356     131.62     2.74     3.85    3.21 (Buy)     -4.46%
13     2008-12-18     212     135.77     3.00     3.85    3.36 (Buy)     0.30%
14     2008-12-17     291     134.27     2.98     3.85    3.35 (Buy)     0.30%
15     2008-12-16     214     133.50     2.96     3.85    3.34 (Buy)     7.40%
16     2008-12-15     216     129.02     2.57     3.85    3.11 (Buy)     -9.06%
17     2008-12-12     105     129.60     3.11     3.85    3.42 (Buy)     9.62%
18     2008-12-11     314     126.06     2.59     3.85    3.12 (Buy)     -12.61%
19     2008-12-10     216     128.62     3.37     3.85    3.57 (Buy)     -0.83%
20     2008-12-09     218     124.51     3.41     3.85    3.60 (Buy)     13.92%

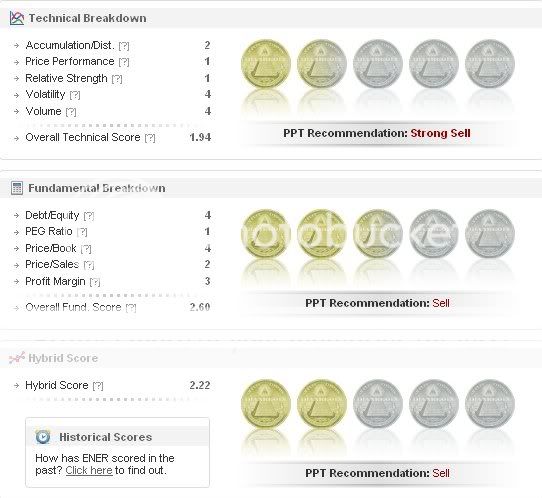
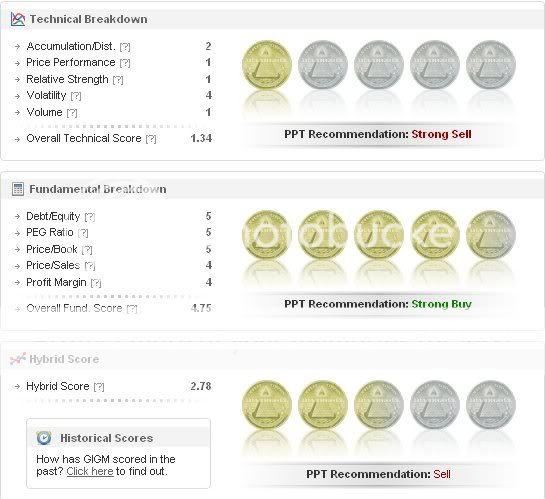
Dizzles – ENER, GIGM

No.    Date    Rank – Daily    Close    Technicals    Fundamentals    Hybrid Score    Hybrid Change
1     2009-01-08     2978     28.97     1.32     2.60    1.86 (Strong Sell)     -1.59%
2     2009-01-07     2884     26.74     1.26     2.75    1.89 (Strong Sell)     -14.48%
3     2009-01-06     2903     29.21     1.93     2.60    2.21 (Sell)     -13.67%
4     2009-01-05     2262     29.38     2.53     2.60    2.56 (Sell)     4.92%
5     2009-01-02     2717     27.80     2.20     2.75    2.44 (Sell)     -1.61%
6     2008-12-31     2481     25.21     2.27     2.75    2.48 (Sell)     4.64%
7     2008-12-30         24.84     2.08     2.75    2.37 (Sell)     19.70%
8     2008-12-29         23.45     1.41     2.75    1.98 (Strong Sell)     8.20%
9     2008-12-26     2581     23.41     1.15     2.75    1.83 (Strong Sell)     0.00%
10     2008-12-24     2756     22.80     1.40     2.75    1.97 (Strong Sell)     -1.50%
11     2008-12-23     2833     23.22     1.45     2.75    2.00 (Sell)     -9.09%
12     2008-12-19     2646     24.72     1.79     2.75    2.20 (Sell)     -5.17%
13     2008-12-18     2353     25.08     2.00     2.75    2.32 (Sell)     -3.33%
14     2008-12-17     2366     25.89     2.13     2.75    2.40 (Sell)     23.08%
15     2008-12-16     2865     22.93     1.36     2.75    1.95 (Strong Sell)     -0.51%
16     2008-12-15     2740     20.86     1.27     2.90    1.96 (Strong Sell)     -11.31%
17     2008-12-12     2381     22.59     1.71     2.90    2.21 (Sell)     9.41%
18     2008-12-11     2673     22.20     1.49     2.75    2.02 (Sell)     -5.16%
19     2008-12-10     2863     21.83     1.57     2.90    2.13 (Sell)     -10.88%
20     2008-12-09     2637     22.05     2.01     2.90    2.39 (Sell)     1.70%

No.    Date    Rank – Daily    Close    Technicals    Fundamentals    Hybrid Score    Hybrid Change
1     2009-01-08     255     6.61     1.92     4.75    3.11 (Buy)     2.98%
2     2009-01-07     323     6.46     1.76     4.75    3.02 (Buy)     -14.45%
3     2009-01-06     160     6.93     2.63     4.75    3.53 (Buy)     5.37%
4     2009-01-05     504     6.63     2.33     4.75    3.35 (Buy)     -6.94%
5     2009-01-02     209     6.01     2.65     4.90    3.60 (Buy)     16.50%
6     2008-12-31     1104     5.63     1.77     4.90    3.09 (Buy)     14.87%
7     2008-12-30         5.31     1.08     4.90    2.69 (Sell)     -1.47%
8     2008-12-29         5.48     1.16     4.90    2.73 (Sell)     0.00%
9     2008-12-26     233     5.60     1.15     4.90    2.73 (Sell)     -4.88%
10     2008-12-24     443     5.74     1.40     4.90    2.87 (Sell)     -4.97%
11     2008-12-23     325     5.87     1.65     4.90    3.02 (Buy)     -2.58%
12     2008-12-19     510     5.95     1.79     4.90    3.10 (Buy)     3.68%
13     2008-12-18     778     5.78     1.60     4.90    2.99 (Sell)     -8.28%
14     2008-12-17     444     6.48     2.18     4.75    3.26 (Buy)     -7.91%
15     2008-12-16     69     5.93     2.56     4.90    3.54 (Buy)     -8.53%
16     2008-12-15     4     5.90     3.12     4.90    3.87 (Buy)     2.38%
17     2008-12-12     13     5.77     2.96     4.90    3.78 (Buy)     0.27%
18     2008-12-11     9     5.37     2.94     4.90    3.77 (Buy)     8.96%
19     2008-12-10     350     4.80     2.42     4.90    3.46 (Buy)     9.15%
20     2008-12-09     905     4.59     1.91     4.90    3.17 (Buy)     -11.94%

Comments »

A Very Sad Day for Maryland

I am from Bethesda, right outside of DC and I grew up in Baltimore when I was a kid just a few years ago. I usually browse the Washington Post and the Baltimore Sun on a daily basis, but this is some bullshit.

If you’re from MD, this is a “WTF” moment…sort of like the one we had during the last hour of today’s trading.

You see, the Mayor of Baltimore just got indicted on 12 counts of all sorts of shit (“allegedly”) that runs parallel to crony capitalism, apparently giving favors to her ex-boyfriend, misappropriating stuff, being charged with theft, perjury, and all the other corrupt stuff that are practiced by other known politicians. This is another case of taxpayers’ money being funneled for personal use.

I’d like to see her get out of this one.

In addition, I, on behalf my fund, recently received the coveted Mayor’s Citation. Is it even worth anything anymore?

Probably not.

So, what does any of this have to do with trading? Well, not much, but in an era where people are getting Madoffed left and right, it’s especially important to do due diligence on people that are in positions of power.

And, of course, if you are a person in that sort of position, please don’t fuck it up.

Comments »