Looks Pretty:
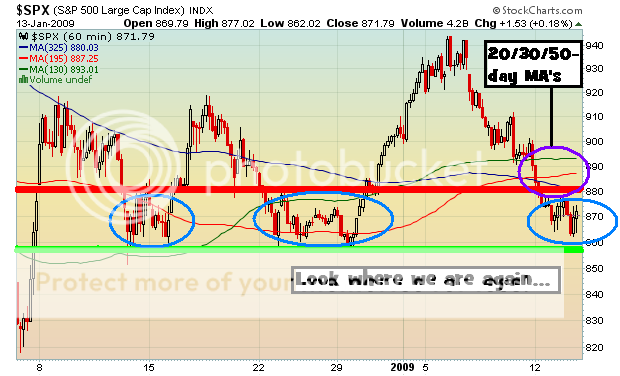
I was twittering all day that we were forming a symmetrical triangle, then an ascending triangle. The breakdown of the triangle set off a cascade down from 12:30PM to 2:00PM. And then, from 2:30PM till 4:00PM, many people got mauled. It is a fact.
Just when you thought that the market was going to breakdown at 3:00PM, you got screwed. The movement in the last hour was definitely impressive, nothing short of a spectacular come back. It made you say “WTF?!”, didn’t it?
The only trades I made were closing out positions in the morning. It’s typically not good to trade on doji days also known as tight-range indecision days marked by very little volatility. Doji tell you that the bulls and bears fought all day long, and neither side could best the other. The market could go 50/50 from here. I did not trade all day long because there was no edge. Did you see one?
We are very close to 857-860 once again. In addition, all three 20-, 30-, and 50-day MA’s are above the SPX, no doubt going to make the SPX’s rally attempt laborious and very irritating. The downside is not that far, in fact, a breakdown is waiting only about 12-15 pts below. Watch the charts, they’ll tell you where YOU need to be.
SPX 1-day
SPX 3-day
SPX 40-day
Here’s a very important observation I made today. Below is a 3.5 month chart of the SPX right now. Below that is a chart of the SPX from 06/08 – 09/08. See any similarities?
1) Price/Volume Divergence – The rally heads higher, but volume isn’t sustained. Here is where volume will be important. Once the range is broken, a burst of volume should be present.
2) 50-day MA Churning – Churning is the equivalent of “hanging out”. In this case, the SPX has repeatedly made numerous attempts to rally on both charts, passing and failing over and over until the MA could no long support the market.
3) Bollinger Bands – The BB’s are currently at their narrowest levels since the August-September rally. The market was in an approx. 50 point range before a major move occured (down). The market right now is in an approx. 87 point range. The more narrow the bands, the more explosive the future move.
4) V-Spike Bottom – Look carefully at both charts and compare their rallies since the first long white candle and it’s trek upwards. It’s similar enough to not ignore.
Keep these things in mind. I’m not saying it’s going to be this way, but it’s nice to know, right?
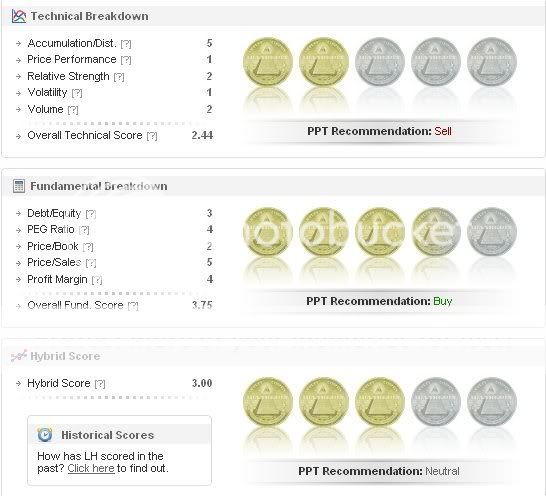
Finally, PPT requests from a cool person (PEP, TOT, LH, AFFX):
No. Date Rank – Daily Close Technicals Fundamentals Hybrid Score Hybrid Change
1 2009-01-13 1147 52.02 1.64 3.96 2.61 (Sell) 6.97%
2 2009-01-12 1288 51.39 1.34 3.96 2.44 (Sell) -5.43%
3 2009-01-09 1110 52.57 1.59 3.96 2.58 (Sell) 0.39%
4 2009-01-08 1527 53.25 1.57 3.96 2.57 (Sell) 1.18%
5 2009-01-07 1380 53.89 1.56 3.91 2.54 (Sell) -4.87%
6 2009-01-06 1988 55.70 1.78 3.91 2.67 (Sell) 2.30%
7 2009-01-05 2125 55.60 1.68 3.91 2.61 (Sell) -13.58%
8 2009-01-02 1425 55.97 2.35 3.95 3.02 (Buy) 10.22%
9 2008-12-31 1909 54.77 1.87 3.95 2.74 (Sell) -4.20%
10 2008-12-30 54.88 2.18 3.82 2.86 (Sell) 22.75%
11 2008-12-29 54.07 1.26 3.82 2.33 (Sell) -5.67%
12 2008-12-26 956 54.56 1.50 3.82 2.47 (Sell) 0.00%
13 2008-12-24 1201 54.54 1.75 3.82 2.62 (Sell) 4.80%
14 2008-12-23 1707 54.17 1.55 3.82 2.50 (Sell) -11.97%
15 2008-12-19 1132 54.09 2.14 3.82 2.84 (Sell) -10.41%
16 2008-12-18 434 54.71 2.70 3.82 3.17 (Buy) 0.63%
17 2008-12-17 680 54.33 2.68 3.82 3.15 (Buy) 8.25%
18 2008-12-16 954 54.21 2.26 3.82 2.91 (Sell) 14.57%
19 2008-12-15 1442 52.42 1.62 3.82 2.54 (Sell) 3.67%
20 2008-12-12 1861 52.03 1.46 3.82 2.45 (Sell) 0.41%
No. Date Rank – Daily Close Technicals Fundamentals Hybrid Score Hybrid Change
1 2009-01-13 1064 51.85 1.00 4.90 2.64 (Sell) 7.76%
2 2009-01-12 1266 52.73 0.68 4.90 2.45 (Sell) -9.59%
3 2009-01-09 706 53.64 1.12 4.90 2.71 (Sell) -2.87%
4 2009-01-08 822 55.97 1.25 4.90 2.79 (Sell) 25.11%
5 2009-01-07 2174 54.85 0.30 4.90 2.23 (Sell) -26.89%
6 2009-01-06 1042 56.28 1.71 4.90 3.05 (Buy) -5.57%
7 2009-01-05 736 56.57 2.01 4.90 3.23 (Buy) -13.64%
8 2009-01-02 106 57.56 2.90 4.90 3.74 (Buy) 7.78%
9 2008-12-31 235 55.30 2.43 4.90 3.47 (Buy) 13.03%
10 2008-12-30 55.30 1.83 4.78 3.07 (Buy) 0.66%
11 2008-12-29 54.07 1.80 4.78 3.05 (Buy) 15.53%
12 2008-12-26 411 53.90 1.08 4.78 2.64 (Sell) 0.76%
13 2008-12-24 1266 53.05 1.02 4.78 2.60 (Sell) -9.09%
14 2008-12-23 672 53.12 1.46 4.78 2.86 (Sell) 1.42%
15 2008-12-19 1190 54.61 1.39 4.78 2.82 (Sell) 9.73%
16 2008-12-18 1807 56.20 0.96 4.78 2.57 (Sell) -19.44%
17 2008-12-17 604 59.58 2.04 4.78 3.19 (Buy) -6.45%
18 2008-12-16 142 58.07 2.42 4.78 3.41 (Buy) 36.95%
19 2008-12-15 1550 54.54 1.25 4.18 2.49 (Sell) -11.39%
20 2008-12-12 933 53.88 1.38 4.78 2.81 (Sell) -18.08%
No. Date Rank – Daily Close Technicals Fundamentals Hybrid Score Hybrid Change
1 2009-01-13 277 61.47 2.44 3.75 3.00 (Neutral) 11.94%
2 2009-01-12 602 60.62 1.79 3.90 2.68 (Sell) 3.47%
3 2009-01-09 1080 60.85 1.64 3.90 2.59 (Sell) -3.00%
4 2009-01-08 1159 60.72 1.77 3.90 2.67 (Sell) -3.96%
5 2009-01-07 720 60.59 1.96 3.90 2.78 (Sell) 5.30%
6 2009-01-06 2047 61.40 1.73 3.90 2.64 (Sell) -15.65%
7 2009-01-05 925 65.66 2.68 3.75 3.13 (Buy) 1.29%
8 2009-01-02 1264 64.93 2.60 3.75 3.09 (Buy) 4.75%
9 2008-12-31 1383 64.41 2.37 3.75 2.95 (Sell) 3.87%
10 2008-12-30 64.17 2.18 3.75 2.84 (Sell) 15.45%
11 2008-12-29 63.51 1.51 3.75 2.46 (Sell) 13.89%
12 2008-12-26 1688 62.93 1.00 3.75 2.16 (Sell) -6.49%
13 2008-12-24 989 61.86 1.90 3.75 2.68 (Sell) -1.11%
14 2008-12-23 1133 62.25 1.95 3.75 2.71 (Sell) 5.86%
15 2008-12-19 1929 63.10 1.69 3.75 2.56 (Sell) -15.51%
16 2008-12-18 686 63.78 2.50 3.75 3.03 (Buy) 0.33%
17 2008-12-17 943 63.65 2.48 3.75 3.02 (Buy) 4.50%
18 2008-12-16 987 63.64 2.26 3.75 2.89 (Sell) 17.48%
19 2008-12-15 1629 61.33 1.42 3.90 2.46 (Sell) 1.23%
20 2008-12-12 1899 62.20 1.46 3.75 2.43 (Sell) 0.41%
No. Date Rank – Daily Close Technicals Fundamentals Hybrid Score Hybrid Change
1 2009-01-13 2056 3.66 1.54 3.20 2.23 (Sell) -1.33%
2 2009-01-12 1729 3.48 1.59 3.20 2.26 (Sell) -21.25%
3 2009-01-09 387 3.84 2.64 3.20 2.87 (Sell) 4.74%
4 2009-01-08 959 3.58 2.42 3.20 2.74 (Sell) 11.84%
5 2009-01-07 1602 3.34 1.91 3.20 2.45 (Sell) -9.93%
6 2009-01-06 1822 3.41 2.38 3.20 2.72 (Sell) 14.77%
7 2009-01-05 2646 3.16 1.78 3.20 2.37 (Sell) -16.84%
8 2009-01-02 1811 3.12 2.60 3.20 2.85 (Sell) 0.00%
9 2008-12-31 1627 2.99 2.42 3.45 2.85 (Sell) 10.89%
10 2008-12-30 2.86 2.03 3.30 2.57 (Sell) 26.60%
11 2008-12-29 2.66 1.11 3.30 2.03 (Sell) 0.00%
12 2008-12-26 1993 2.66 1.10 3.30 2.03 (Sell) 0.00%
13 2008-12-24 2281 2.70 1.35 3.30 2.17 (Sell) -7.66%
14 2008-12-23 2028 2.79 1.65 3.30 2.35 (Sell) -3.29%
15 2008-12-19 2206 2.71 1.79 3.30 2.43 (Sell) 4.74%
16 2008-12-18 2345 2.70 1.60 3.30 2.32 (Sell) -11.79%
17 2008-12-17 1847 2.88 2.13 3.30 2.63 (Sell) 20.64%
18 2008-12-16 2523 2.64 1.36 3.30 2.18 (Sell) -4.39%
19 2008-12-15 2061 2.45 1.47 3.40 2.28 (Sell) 4.11%
20 2008-12-12 2417 2.45 1.31 3.40 2.19 (Sell) 2.34%


The first chart is an ascending triangle, it’s not symmetrical.
I blame it on the Grey Goose.
Well at least you have the proper taste in vodka.
Thanks for the post. How do you decide during the day if we are in Doji? I’m guessing you watch spx and threshold percent moves tho thought to ask your guides.
On the 40-day chart there are little red squares above some of the candles. How did you get these there, and of what significance are they. I use stockcharts also, so wondered if they were just drawn in, or an indicator I did not know about.
Nice summary and analysis. Thanks.
Yes proper Vodka is important. You kick ass your charts are great.
Bob – I monitor the day’s range. You’ll only know for sure end of day, but you can make a reasonable guess.
SB – I added them to highlight the excessive churning that is (was) occurring at the 50-day MA.
FYI – LOOKS LIKE SEPT 2008! OH SHIT!
CA,
Look at our range of 855 – 920
920 got broken by about 24 pts and now 855 has been broken by about 18 pts
Could 835 – 945 be our new range?
I’m starting very small positions on the long side here and will slowly increase until a big volume reversal.
We forming a bear continuation flag so far (the whole day).
I’d say 820-860 is the new range.