Watch for a bounce off of 880 on the SPX. If we slice through and breakdown from here, then we’re looking at 860 (again).
The financial sector is already breaking down. That will be my focus for today.The market will not be able to sustain a rally without the financials.
————————————————
MORE PPT REQUESTS:
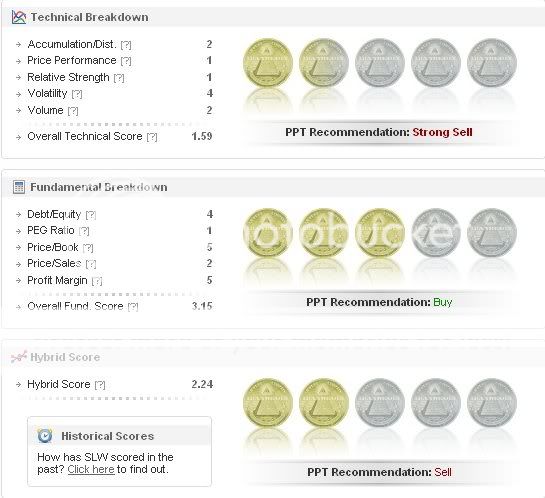
John – SLW, AEM
No. Date Rank – Daily Close Technicals Fundamentals Hybrid Score Hybrid Change
1 2009-01-09 1983 6.18 1.59 3.15 2.24 (Sell) -5.08%
2 2009-01-08 2008 6.15 1.80 3.15 2.36 (Sell) 12.92%
3 2009-01-07 2492 5.71 1.33 3.15 2.09 (Sell) -8.33%
4 2009-01-06 2813 6.51 1.65 3.15 2.28 (Sell) 4.59%
5 2009-01-05 2909 6.25 1.48 3.15 2.18 (Sell) -15.18%
6 2009-01-02 2511 6.58 2.15 3.15 2.57 (Sell) 9.83%
7 2008-12-31 2705 6.49 1.75 3.15 2.34 (Sell) -4.49%
8 2008-12-30 6.41 1.95 3.15 2.45 (Sell) -3.54%
9 2008-12-29 6.46 2.11 3.15 2.54 (Sell) 0.00%
10 2008-12-26 711 6.13 2.10 3.15 2.54 (Sell) 29.59%
11 2008-12-24 1821 5.64 1.81 3.15 2.37 (Sell) 1.28%
12 2008-12-23 2035 5.56 1.76 3.15 2.34 (Sell) -9.65%
13 2008-12-19 1854 5.69 2.19 3.15 2.59 (Sell) 2.37%
14 2008-12-18 1886 5.40 2.09 3.15 2.53 (Sell) -15.10%
15 2008-12-17 1033 6.14 2.86 3.15 2.98 (Sell) 3.83%
16 2008-12-16 1040 5.92 2.68 3.15 2.87 (Sell) -1.37%
17 2008-12-15 469 5.07 2.74 3.15 2.91 (Sell) 6.20%
18 2008-12-12 1137 4.53 2.45 3.15 2.74 (Sell) -6.80%
19 2008-12-11 554 4.34 2.79 3.15 2.94 (Sell) 4.26%
20 2008-12-10 1572 4.04 2.59 3.15 2.82 (Sell) 1.44%
No. Date Rank – Daily Close Technicals Fundamentals Hybrid Score Hybrid Change
1 2009-01-09 1331 49.95 1.69 3.67 2.52 (Sell) -9.68%
2 2009-01-08 879 50.34 2.16 3.67 2.79 (Sell) 30.99%
3 2009-01-07 2395 46.87 1.01 3.67 2.13 (Sell) -26.04%
4 2009-01-06 1317 51.56 2.31 3.67 2.88 (Sell) 26.32%
5 2009-01-05 2786 49.65 1.27 3.67 2.28 (Sell) -6.94%
6 2009-01-02 2708 50.95 1.57 3.67 2.45 (Sell) -17.51%
7 2008-12-31 1355 51.33 2.46 3.67 2.97 (Sell) 12.08%
8 2008-12-30 50.24 1.91 3.66 2.65 (Sell) -9.25%
9 2008-12-29 50.76 2.38 3.66 2.92 (Sell) 14.06%
10 2008-12-26 616 47.87 1.75 3.66 2.56 (Sell) 11.79%
11 2008-12-24 1104 47.09 1.89 3.66 2.64 (Sell) 5.18%
12 2008-12-23 1694 46.46 1.68 3.66 2.51 (Sell) 6.81%
13 2008-12-19 2362 46.62 1.83 3.06 2.35 (Sell) 5.86%
14 2008-12-18 2547 43.67 1.50 3.21 2.22 (Sell) -32.52%
15 2008-12-17 382 45.84 3.45 3.06 3.29 (Buy) 9.67%
16 2008-12-16 768 46.45 2.95 3.06 3.00 (Neutral) 0.67%
17 2008-12-15 366 42.31 2.81 3.21 2.98 (Sell) 1.71%
18 2008-12-12 605 38.98 2.72 3.21 2.93 (Sell) -1.01%
19 2008-12-11 514 36.40 2.78 3.21 2.96 (Sell) 2.78%
20 2008-12-10 1400 36.44 2.63 3.21 2.88 (Sell) 2.49%
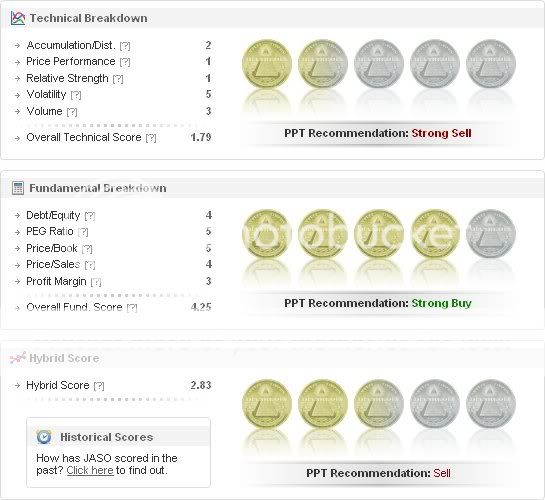
EN1GMA – SRS (no fundamental score – ETF), JASO
No. Date Close Technicals
1 2009-01-09 58.5 2.49 Sell
2 2009-01-08 53.71 1.72 Strong Sell
3 2009-01-07 52.53 1.46 Strong Sell
4 2009-01-06 49.74 1.63 Strong Sell
5 2009-01-05 55.26 1.73 Strong Sell
6 2009-01-02 53.23 1.7 Strong Sell
7 2008-12-31 50.71 1.47 Strong Sell
8 2008-12-30 56.16 1.48 Strong Sell
9 2008-12-29 61.11 2.16 Sell
10 2008-12-26 55.5 1.15 Strong Sell
11 2008-12-24 56.65 1.8 Strong Sell
12 2008-12-23 57.3 1.85 Strong Sell
13 2008-12-19 54.34 2.19 Sell
14 2008-12-18 60.8 2.25 Sell
15 2008-12-17 52.89 1.78 Strong Sell
16 2008-12-16 57.1 1.76 Strong Sell
17 2008-12-15 75.56 2.12 Sell
18 2008-12-12 71.44 1.76 Strong Sell
19 2008-12-11 88.43 2.74 Sell
20 2008-12-10 70.95 2.22 Sell
No. Date Rank – Daily Close Technicals Fundamentals Hybrid Score Hybrid Change
1 2009-01-09 437 4.66 1.79 4.25 2.83 (Sell) 3.66%
2 2009-01-08 1001 4.36 1.52 4.40 2.73 (Sell) 2.25%
3 2009-01-07 994 4.21 1.51 4.25 2.67 (Sell) -11.88%
4 2009-01-06 1067 4.95 2.13 4.25 3.03 (Buy) -10.88%
5 2009-01-05 409 5.09 2.78 4.25 3.40 (Buy) 1.19%
6 2009-01-02 588 4.84 2.70 4.25 3.36 (Buy) -8.20%
7 2008-12-31 95 4.37 3.12 4.40 3.66 (Buy) 18.45%
8 2008-12-30 4.42 2.13 4.40 3.09 (Buy) -1.28%
9 2008-12-29 3.43 2.21 4.40 3.13 (Buy) 22.75%
10 2008-12-26 666 3.25 1.20 4.40 2.55 (Sell) 0.00%
11 2008-12-24 956 3.21 1.45 4.40 2.69 (Sell) -1.10%
12 2008-12-23 1109 3.40 1.50 4.40 2.72 (Sell) -16.82%
13 2008-12-19 300 3.38 2.44 4.40 3.27 (Buy) -6.57%
14 2008-12-18 128 3.38 2.85 4.40 3.50 (Buy) 3.55%
15 2008-12-17 259 3.46 2.43 4.70 3.38 (Buy) 17.77%
16 2008-12-16 1024 2.90 1.46 4.80 2.87 (Sell) -3.04%
17 2008-12-15 394 2.95 1.62 4.80 2.96 (Sell) -4.52%
18 2008-12-12 339 3.04 1.86 4.80 3.10 (Buy) 5.44%
19 2008-12-11 550 2.85 1.59 4.80 2.94 (Sell) 2.44%
20 2008-12-10 1441 2.85 1.47 4.80 2.87 (Sell) -3.04%
Lerner – GS, MA
No. Date Rank – Daily Close Technicals Fundamentals Hybrid Score Hybrid Change
1 2009-01-09 2207 83.88 1.04 3.68 2.15 (Sell) 0.47%
2 2009-01-08 2507 85.41 1.02 3.69 2.14 (Sell) -9.70%
3 2009-01-07 1812 84.50 1.41 3.68 2.37 (Sell) -5.95%
4 2009-01-06 2374 88.71 1.68 3.68 2.52 (Sell) -12.20%
5 2009-01-05 1439 88.78 2.28 3.68 2.87 (Sell) 1.41%
6 2009-01-02 1845 86.76 2.20 3.69 2.83 (Sell) -0.35%
7 2008-12-31 1640 84.39 2.22 3.69 2.84 (Sell) 5.19%
8 2008-12-30 82.06 2.03 3.62 2.70 (Sell) 25.00%
9 2008-12-29 76.56 1.11 3.62 2.16 (Sell) 0.00%
10 2008-12-26 1685 75.97 1.10 3.62 2.16 (Sell) 0.00%
11 2008-12-24 1968 76.44 1.35 3.62 2.30 (Sell) -1.29%
12 2008-12-23 2065 75.20 1.40 3.62 2.33 (Sell) -19.10%
13 2008-12-19 1035 80.73 2.34 3.62 2.88 (Sell) 9.09%
14 2008-12-18 1606 80.05 2.55 2.77 2.64 (Sell) -5.38%
15 2008-12-17 1494 78.78 2.73 2.87 2.79 (Sell) 14.81%
16 2008-12-16 2087 76.00 2.11 2.87 2.43 (Sell) 24.62%
17 2008-12-15 2752 66.46 1.27 2.87 1.95 (Strong Sell) -1.02%
18 2008-12-12 2856 67.74 1.31 2.87 1.97 (Strong Sell) 0.51%
19 2008-12-11 2790 69.71 1.29 2.87 1.96 (Strong Sell) -2.00%
20 2008-12-10 3014 71.53 1.37 2.87 2.00 (Sell) -12.66%
No. Date Rank – Daily Close Technicals Fundamentals Hybrid Score Hybrid Change
1 2009-01-09 3101 149.77 1.29 2.12 1.64 (Strong Sell) -5.75%
2 2009-01-08 3106 152.78 1.47 2.13 1.74 (Strong Sell) -5.95%
3 2009-01-07 2952 152.07 1.66 2.12 1.85 (Strong Sell) -19.57%
4 2009-01-06 2788 161.87 2.43 2.12 2.30 (Sell) -2.54%
5 2009-01-05 2673 153.12 2.53 2.12 2.36 (Sell) 7.27%
6 2009-01-02 3017 149.64 2.25 2.12 2.20 (Sell) -0.45%
7 2008-12-31 2861 142.80 2.27 2.12 2.21 (Sell) 45.39%
8 2008-12-30 138.96 1.08 2.11 1.52 (Strong Sell) -2.56%
9 2008-12-29 139.21 1.16 2.11 1.56 (Strong Sell) 0.00%
10 2008-12-26 3096 140.80 1.15 2.11 1.56 (Strong Sell) 0.00%
11 2008-12-24 3119 142.10 1.40 2.11 1.70 (Strong Sell) -1.73%
12 2008-12-23 3130 141.49 1.45 2.11 1.73 (Strong Sell) -16.43%
13 2008-12-19 2851 152.20 2.04 2.11 2.07 (Sell) -9.21%
14 2008-12-18 2432 148.67 2.40 2.11 2.28 (Sell) 6.05%
15 2008-12-17 2757 148.54 2.18 2.11 2.15 (Sell) 0.47%
16 2008-12-16 2599 147.96 2.16 2.11 2.14 (Sell) 18.89%
17 2008-12-15 3008 139.16 1.57 2.11 1.80 (Strong Sell) 7.14%
18 2008-12-12 3149 138.68 1.36 2.11 1.68 (Strong Sell) 0.60%
19 2008-12-11 3138 138.23 1.34 2.11 1.67 (Strong Sell) -10.22%
20 2008-12-10 3111 144.87 1.67 2.11 1.86 (Strong Sell) -16.59%
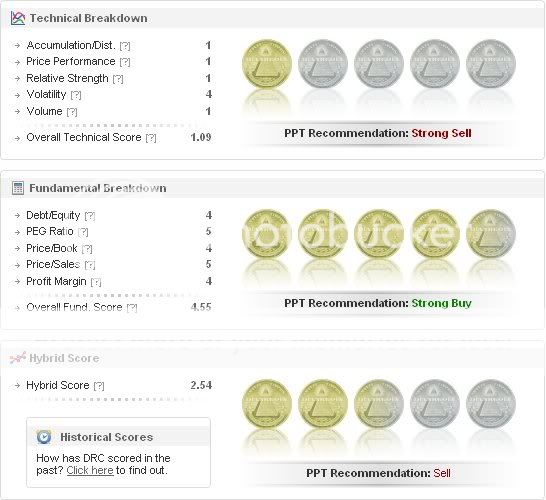
E8 – AIZ, KWK, DRC, MAN
No. Date Rank – Daily Close Technicals Fundamentals Hybrid Score Hybrid Change
1 2009-01-09 1172 30.15 1.04 4.69 2.57 (Sell) -16.56%
2 2009-01-08 311 30.81 1.92 4.69 3.08 (Buy) 15.36%
3 2009-01-07 980 29.91 1.21 4.69 2.67 (Sell) -20.30%
4 2009-01-06 404 30.99 2.38 4.69 3.35 (Buy) 11.67%
5 2009-01-05 1127 29.77 1.78 4.69 3.00 (Neutral) -7.69%
6 2009-01-02 864 30.24 2.20 4.70 3.25 (Buy) -0.31%
7 2008-12-31 686 30.00 2.22 4.70 3.26 (Buy) 4.49%
8 2008-12-30 28.90 2.03 4.61 3.12 (Buy) 14.29%
9 2008-12-29 27.06 1.36 4.61 2.73 (Sell) 5.81%
10 2008-12-26 549 26.55 1.10 4.61 2.58 (Sell) 0.00%
11 2008-12-24 835 26.24 1.35 4.61 2.72 (Sell) -1.09%
12 2008-12-23 1030 26.29 1.40 4.61 2.75 (Sell) -22.10%
13 2008-12-19 104 27.74 2.74 4.61 3.53 (Buy) 6.97%
14 2008-12-18 278 26.42 2.35 4.61 3.30 (Buy) 10.00%
15 2008-12-17 971 25.10 1.83 4.61 3.00 (Neutral) -5.06%
16 2008-12-16 482 25.75 2.11 4.61 3.16 (Buy) 13.26%
17 2008-12-15 739 21.81 1.47 4.61 2.79 (Sell) -1.06%
18 2008-12-12 876 22.27 1.51 4.61 2.82 (Sell) 4.83%
19 2008-12-11 1125 22.07 1.29 4.61 2.69 (Sell) -10.33%
20 2008-12-10 1093 22.93 1.82 4.61 3.00 (Neutral) -8.54%
No. Date Rank – Daily Close Technicals Fundamentals Hybrid Score Hybrid Change
1 2009-01-09 966 8.27 1.67 3.95 2.63 (Sell) -10.54%
2 2009-01-08 427 8.52 2.20 3.95 2.94 (Sell) 8.89%
3 2009-01-07 971 8.55 1.80 3.95 2.70 (Sell) -16.41%
4 2009-01-06 664 8.36 2.71 3.95 3.23 (Buy) 1.89%
5 2009-01-05 845 6.81 2.61 3.95 3.17 (Buy) -4.52%
6 2009-01-02 682 6.21 2.75 4.10 3.32 (Buy) 12.93%
7 2008-12-31 1399 5.57 2.28 3.85 2.94 (Sell) 13.51%
8 2008-12-30 5.35 1.68 3.85 2.59 (Sell) -4.78%
9 2008-12-29 5.17 1.90 3.85 2.72 (Sell) 18.26%
10 2008-12-26 1395 5.07 1.18 3.85 2.30 (Sell) 0.44%
11 2008-12-24 1773 4.99 1.32 3.85 2.39 (Sell) -9.47%
12 2008-12-23 1337 5.11 1.76 3.85 2.64 (Sell) -16.98%
13 2008-12-19 398 5.77 2.69 3.85 3.18 (Buy) 52.15%
14 2008-12-18 2806 5.30 0.81 3.85 2.09 (Sell) -23.16%
15 2008-12-17 1673 5.66 1.89 3.85 2.72 (Sell) 3.82%
16 2008-12-16 1657 5.39 1.72 3.85 2.62 (Sell) 3.97%
17 2008-12-15 1488 5.10 1.55 3.85 2.52 (Sell) -10.95%
18 2008-12-12 857 5.17 2.08 3.85 2.83 (Sell) -15.02%
19 2008-12-11 157 5.27 2.94 3.85 3.33 (Buy) -2.35%
20 2008-12-10 427 5.34 3.09 3.85 3.41 (Buy) 9.29%
No. Date Rank – Daily Close Technicals Fundamentals Hybrid Score Hybrid Change
1 2009-01-09 1259 19.24 1.09 4.55 2.54 (Sell) -16.72%
2 2009-01-08 344 19.74 1.97 4.55 3.05 (Buy) 5.17%
3 2009-01-07 505 19.35 1.71 4.55 2.90 (Sell) -14.96%
4 2009-01-06 311 19.40 2.58 4.55 3.41 (Buy) 15.99%
5 2009-01-05 1264 18.50 1.78 4.55 2.94 (Sell) -7.84%
6 2009-01-02 1025 18.77 2.20 4.55 3.19 (Buy) -2.15%
7 2008-12-31 652 17.25 2.22 4.70 3.26 (Buy) 3.49%
8 2008-12-30 17.01 2.03 4.70 3.15 (Buy) -1.25%
9 2008-12-29 16.37 2.11 4.70 3.19 (Buy) 22.22%
10 2008-12-26 466 16.33 1.10 4.70 2.61 (Sell) 0.00%
11 2008-12-24 745 15.75 1.35 4.70 2.75 (Sell) -1.08%
12 2008-12-23 942 15.91 1.40 4.70 2.78 (Sell) -6.71%
13 2008-12-19 740 16.42 1.74 4.70 2.98 (Sell) -0.33%
14 2008-12-18 775 16.44 1.75 4.70 2.99 (Sell) 13.69%
15 2008-12-17 1852 17.15 1.13 4.70 2.63 (Sell) -9.31%
16 2008-12-16 964 18.07 1.61 4.70 2.90 (Sell) 7.01%
17 2008-12-15 962 16.96 1.27 4.70 2.71 (Sell) -5.57%
18 2008-12-12 761 17.44 1.56 4.70 2.87 (Sell) 0.35%
19 2008-12-11 693 17.59 1.54 4.70 2.86 (Sell) -20.11%
20 2008-12-10 207 17.86 2.77 4.70 3.58 (Buy) -0.56%
No. Date Rank – Daily Close Technicals Fundamentals Hybrid Score Hybrid Change
1 2009-01-09 2204 33.11 1.44 3.11 2.15 (Sell) 0.94%
2 2009-01-08 2532 34.72 1.42 3.11 2.13 (Sell) 5.97%
3 2009-01-07 2698 33.74 1.21 3.11 2.01 (Sell) -28.47%
4 2009-01-06 1582 35.73 2.58 3.11 2.81 (Sell) 14.23%
5 2009-01-05 2495 34.69 1.98 3.11 2.46 (Sell) -5.02%
6 2009-01-02 2478 34.96 2.20 3.12 2.59 (Sell) -0.38%
7 2008-12-31 2236 33.99 2.22 3.12 2.60 (Sell) 6.12%
8 2008-12-30 32.77 2.03 3.02 2.45 (Sell) 28.27%
9 2008-12-29 31.77 1.11 3.02 1.91 (Strong Sell) 0.00%
10 2008-12-26 2334 31.95 1.10 3.02 1.91 (Strong Sell) 0.00%
11 2008-12-24 2292 30.90 1.55 3.02 2.17 (Sell) -6.06%
12 2008-12-23 2101 30.98 1.80 3.02 2.31 (Sell) -22.48%
13 2008-12-19 743 36.40 2.94 3.02 2.98 (Sell) 8.36%
14 2008-12-18 1336 35.27 2.55 3.02 2.75 (Sell) 0.36%
15 2008-12-17 1623 35.10 2.53 3.02 2.74 (Sell) 0.37%
16 2008-12-16 1368 33.58 2.51 3.02 2.73 (Sell) 20.26%
17 2008-12-15 2067 31.52 1.72 3.02 2.27 (Sell) -0.87%
18 2008-12-12 2218 32.65 1.76 3.02 2.29 (Sell) 7.51%
19 2008-12-11 2450 30.67 1.49 3.02 2.13 (Sell) -12.70%
20 2008-12-10 2367 32.71 2.02 3.02 2.44 (Sell) -9.63%
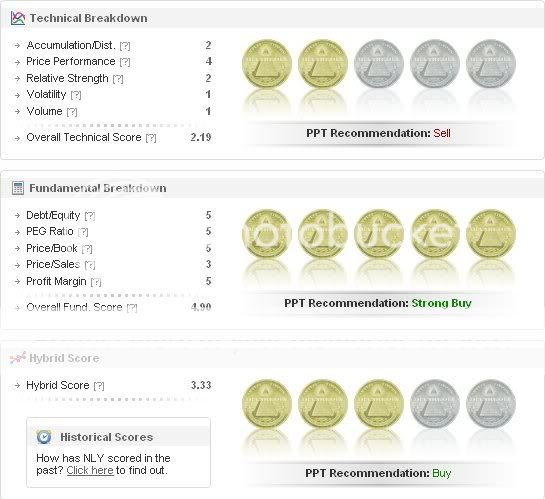
Sleepy – NLY, FMY (not in db), AIB, AWK
No. Date Rank – Daily Close Technicals Fundamentals Hybrid Score Hybrid Change
1 2009-01-09 66 15.89 2.19 4.90 3.33 (Buy) -13.95%
2 2009-01-08 20 15.97 3.12 4.90 3.87 (Buy) 12.83%
3 2009-01-07 57 15.76 2.36 4.90 3.43 (Buy) -13.38%
4 2009-01-06 20 15.95 3.28 4.90 3.96 (Buy) 19.28%
5 2009-01-05 560 15.34 2.18 4.90 3.32 (Buy) 1.22%
6 2009-01-02 772 15.27 2.10 4.90 3.28 (Buy) -15.25%
7 2008-12-31 50 15.87 3.12 4.90 3.87 (Buy) 24.44%
8 2008-12-30 15.29 1.93 4.73 3.11 (Buy) -1.58%
9 2008-12-29 15.00 2.01 4.73 3.16 (Buy) -4.24%
10 2008-12-26 20 15.71 2.25 4.73 3.30 (Buy) -11.53%
11 2008-12-24 6 15.59 3.25 4.73 3.88 (Buy) -3.48%
12 2008-12-23 8 15.62 3.50 4.73 4.02 (Strong Buy) 14.20%
13 2008-12-19 115 15.20 2.64 4.73 3.52 (Buy) -0.28%
14 2008-12-18 110 14.48 2.65 4.73 3.53 (Buy) -13.90%
15 2008-12-17 11 15.40 3.63 4.73 4.10 (Strong Buy) 6.49%
16 2008-12-16 18 15.35 3.21 4.73 3.85 (Buy) 2.12%
17 2008-12-15 8 14.20 3.07 4.73 3.77 (Buy) 8.65%
18 2008-12-12 79 14.46 2.56 4.73 3.47 (Buy) 2.66%
19 2008-12-11 141 13.25 2.39 4.73 3.38 (Buy) -8.15%
20 2008-12-10 117 14.42 2.92 4.73 3.68 (Buy) 0.00%
No. Date Rank – Daily Close Technicals Fundamentals Hybrid Score Hybrid Change
1 2009-01-09 109 5.44 2.29 4.50 3.22 (Buy) -3.01%
2 2009-01-08 117 5.38 2.47 4.50 3.32 (Buy) 19.86%
3 2009-01-07 732 5.10 1.51 4.50 2.77 (Sell) -16.06%
4 2009-01-06 519 4.97 2.43 4.50 3.30 (Buy) 18.71%
5 2009-01-05 1678 4.77 1.53 4.50 2.78 (Sell) -18.95%
6 2009-01-02 449 4.84 2.65 4.50 3.43 (Buy) 17.06%
7 2008-12-31 1449 4.69 1.97 4.25 2.93 (Sell) 24.68%
8 2008-12-30 4.71 1.08 4.09 2.35 (Sell) -1.67%
9 2008-12-29 4.59 1.16 4.09 2.39 (Sell) 0.00%
10 2008-12-26 1162 4.72 1.15 4.09 2.39 (Sell) 0.00%
11 2008-12-24 1450 4.80 1.40 4.09 2.53 (Sell) -13.06%
12 2008-12-23 561 4.89 2.05 4.09 2.91 (Sell) 5.43%
13 2008-12-19 1363 4.59 1.79 4.09 2.76 (Sell) 9.09%
14 2008-12-18 1869 4.93 1.40 4.09 2.53 (Sell) -4.17%
15 2008-12-17 1831 5.33 1.58 4.09 2.64 (Sell) -14.56%
16 2008-12-16 621 5.77 2.36 4.09 3.09 (Buy) 24.10%
17 2008-12-15 1574 5.33 1.32 4.09 2.49 (Sell) -0.80%
18 2008-12-12 1718 5.35 1.36 4.09 2.51 (Sell) 0.40%
19 2008-12-11 1621 5.48 1.34 4.09 2.50 (Sell) -19.87%
20 2008-12-10 831 5.91 2.42 4.09 3.12 (Buy) -2.50%
No. Date Rank – Daily Close Technicals Fundamentals Hybrid Score Hybrid Change
1 2009-01-09 1200 20.71 2.49 2.66 2.56 (Sell) 29.29%
2 2009-01-08 2811 20.19 1.47 2.70 1.98 (Strong Sell) 0.51%
3 2009-01-07 2760 20.02 1.46 2.66 1.97 (Strong Sell) -4.83%
4 2009-01-06 3005 20.49 1.63 2.66 2.07 (Sell) -4.17%
5 2009-01-05 2927 20.49 1.78 2.70 2.16 (Sell) -9.24%
6 2009-01-02 2812 21.12 2.15 2.70 2.38 (Sell) -8.11%
7 2008-12-31 2246 20.88 2.52 2.70 2.59 (Sell) 28.86%
8 2008-12-30 19.75 1.73 2.41 2.01 (Sell) -15.55%
9 2008-12-29 20.94 2.36 2.41 2.38 (Sell) 14.42%
10 2008-12-26 1859 21.78 1.85 2.41 2.08 (Sell) -21.80%
11 2008-12-24 196 21.92 3.55 2.41 3.07 (Buy) -12.29%
12 2008-12-23 67 22.16 4.30 2.41 3.50 (Buy) 59.82%
13 2008-12-19 2657 21.09 2.04 2.41 2.19 (Sell) -20.36%
14 2008-12-18 1323 20.74 3.00 2.41 2.75 (Sell) -17.91%
15 2008-12-17 290 21.82 4.03 2.41 3.35 (Buy) 13.18%
16 2008-12-16 843 20.94 3.36 2.41 2.96 (Sell) 12.98%
17 2008-12-15 1244 20.64 2.77 2.41 2.62 (Sell) 0.38%
18 2008-12-12 1495 20.41 2.76 2.41 2.61 (Sell) 5.24%
19 2008-12-11 1664 20.70 2.54 2.41 2.48 (Sell) -11.11%
20 2008-12-10 1619 20.67 3.07 2.41 2.79 (Sell) -8.52%
FastEddie – OSK
No. Date Rank – Daily Close Technicals Fundamentals Hybrid Score Hybrid Change
1 2009-01-09 2007 11.32 1.69 2.98 2.23 (Sell) -0.89%
2 2009-01-08 2277 11.45 1.72 2.97 2.25 (Sell) -19.35%
3 2009-01-07 697 11.94 2.66 2.97 2.79 (Sell) -7.31%
4 2009-01-06 1099 12.00 3.03 2.98 3.01 (Buy) 5.99%
5 2009-01-05 1519 11.33 2.73 3.00 2.84 (Sell) 5.97%
6 2009-01-02 2252 10.30 2.45 3.00 2.68 (Sell) 3.47%
7 2008-12-31 2259 8.89 2.47 2.75 2.59 (Sell) 13.10%
8 2008-12-30 8.29 2.08 2.56 2.29 (Sell) 30.86%
9 2008-12-29 7.64 1.16 2.56 1.75 (Strong Sell) 0.00%
10 2008-12-26 2761 7.94 1.15 2.56 1.75 (Strong Sell) 0.00%
11 2008-12-24 2913 7.84 1.40 2.56 1.89 (Strong Sell) -7.35%
12 2008-12-23 2750 7.66 1.65 2.56 2.04 (Sell) 2.00%
13 2008-12-19 2963 8.44 1.59 2.56 2.00 (Sell) -6.98%
14 2008-12-18 2694 8.59 1.85 2.56 2.15 (Sell) -12.60%
15 2008-12-17 2246 9.07 2.38 2.56 2.46 (Sell) 5.58%
16 2008-12-16 2269 8.41 2.16 2.56 2.33 (Sell) 17.09%
17 2008-12-15 2675 7.83 1.57 2.56 1.99 (Strong Sell) -1.00%
18 2008-12-12 2787 8.04 1.61 2.56 2.01 (Sell) 2.03%
19 2008-12-11 2778 7.56 1.54 2.56 1.97 (Strong Sell) -24.23%
20 2008-12-10 2037 7.90 2.62 2.56 2.60 (Sell) 1.56%









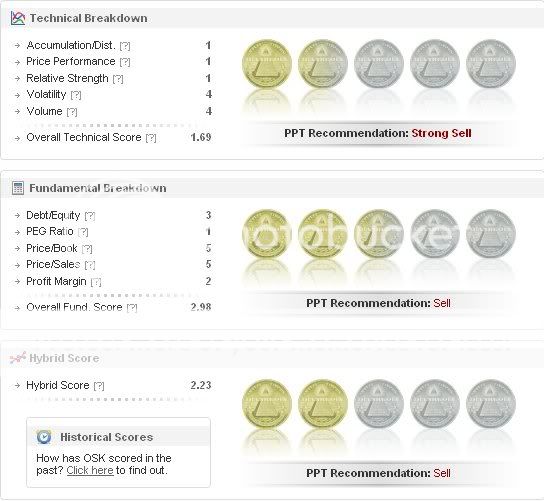


NOTE: PPT is designed to punish marginal names. So, while you may see your stock rec’d a strong sell, another name in the same sector may be ranked a buy.
In other words, PPT will guide the user towards better quality names and forgo the huge spikes of lesser names, which in fact is a good rule of thumb to use when investing.
You still up fly?
looks like you exceeded your bandwidth on photobucket?
I must have maxed out my monthly space of 25GBs.
pwnd
So buy when the needle is out of the red?