I’m probably the only blogger that didn’t put up a post on The PPT yet, so here goes. This review is entirely my own opinion of The PPT. 99% of trading products that are sold are total scams or simply do not work. This post is in response to the people who think The PPT is part of that 99%. Let it be known that The PPT is the other 1%. I endorse it and here’s why:
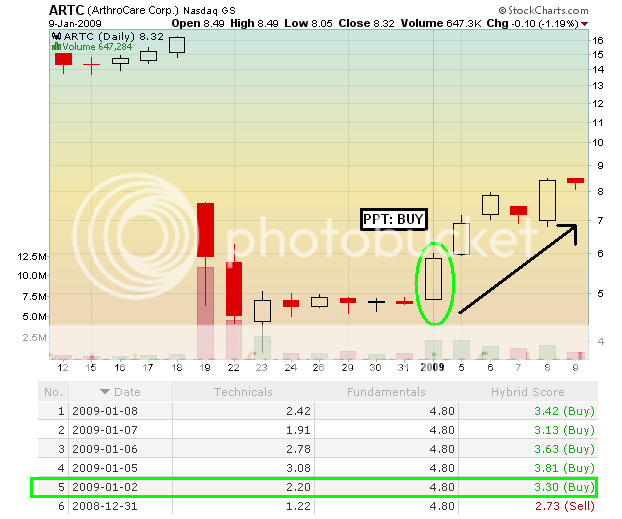
My absolute favorite feature on The PPT is the extremely accurate entry & exit signals. Don’t believe me? I decided to run some of my top spiker trades of last week (FTK, ARTC, APL, GFIG, AER, GLS, MEA) through The PPT‘s Historical Scores function, and here are the no-bullshit results:
———————————————————
Let’s do a quick and random scan:
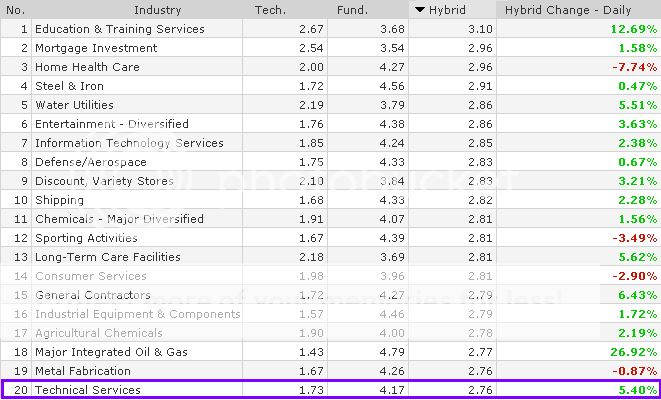
Let’s say I want to see the top 20 industries right now.
We all know “Education & Training Servcies” is #1 because Gio made more than enough coin to go into the weekend very satisfied.
But, let’s consider #20, which is “Technical Services”.
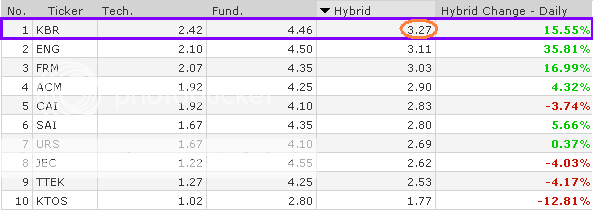
Here are the industry’s components:
I sorted the screen so that the stock with the top hybrid score came up. It was KBR with a 3.27.
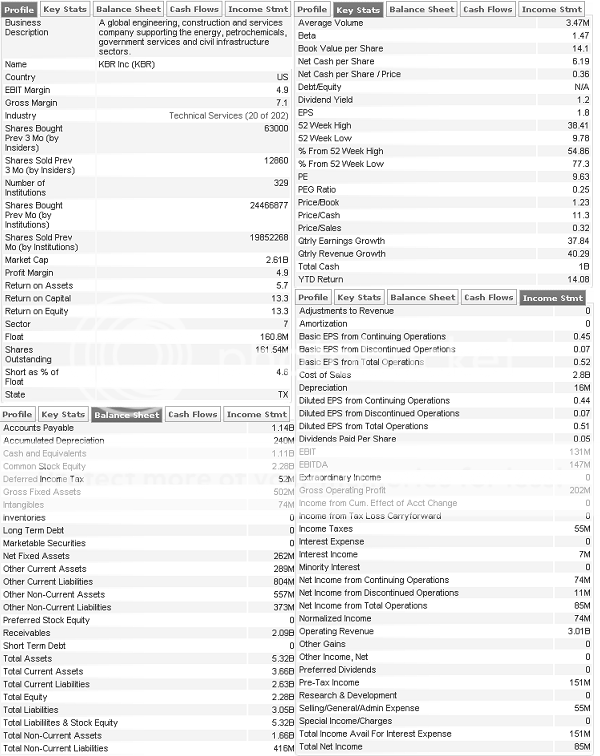
A summary shows that The PPT recommends KBR as a “BUY“:
Like I said, my favorite function is the ability to look up a stock’s historical PPT scores. As a technical trader, I base my decisions on trends and looking at a stock’s scoring trend on The PPT is no different:
We can see that the initial “BUY” signal came on 12/30/2008 with a 3.03. The score steadily improved since then. A “SELL” signal came on 1/07/2009 with a 2.83. A “BUY” signal came shortly after the next day.
There is also a boatload of fundamentals for all of you people that are good at math:
This is why The PPT is the other 1%. I can’t think of any other program that comes close. I googled “stock trading programs” and there were 726,000 hits, no doubt the vast majority of them being junk. You’re looking at a fucking time machine here.
There is a lot of interest for individual PPT scans. To make it easier for the rest of the bloggers, I will honor any PPT requests. Make sure they are not duplicates that Gio is working on.
Here’s how to order: Leave a comment with your picks and I’ll get you the summary and historical scores.
Limit two (2) per person, but if you order now, I’ll double the offer!
We can’t do this all day. Offer ends on midnight.
———————————————————
PERSONAL REQUESTS:
BG – XLF (no fundamental score)
No. Date Close Technicals
1 2009-01-08 11.94 1.22 Strong Sell
2 2009-01-07 11.99 1.21 Strong Sell
3 2009-01-06 12.65 1.43 Strong Sell
4 2009-01-05 12.45 1.53 Strong Sell
5 2009-01-02 12.66 2.2 Sell
6 2008-12-31 12.52 2.22 Sell
7 2008-12-30 12.13 2.03 Sell
8 2008-12-29 11.68 1.11 Strong Sell
9 2008-12-26 11.78 1.1 Strong Sell
10 2008-12-24 11.77 1.35 Strong Sell
11 2008-12-23 11.52 1.4 Strong Sell
12 2008-12-19 12.23 1.54 Strong Sell
13 2008-12-18 12.26 1.8 Strong Sell
14 2008-12-17 12.62 2.13 Sell
15 2008-12-16 12.74 2.11 Sell
16 2008-12-15 11.46 1.27 Strong Sell
17 2008-12-12 11.95 1.51 Strong Sell
18 2008-12-11 11.72 1.49 Strong Sell
19 2008-12-10 12.7 2.02 Sell
20 2008-12-09 12.93 2.26 Sell
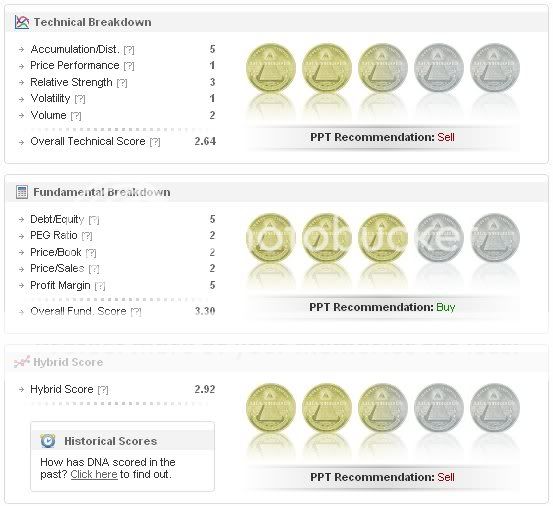
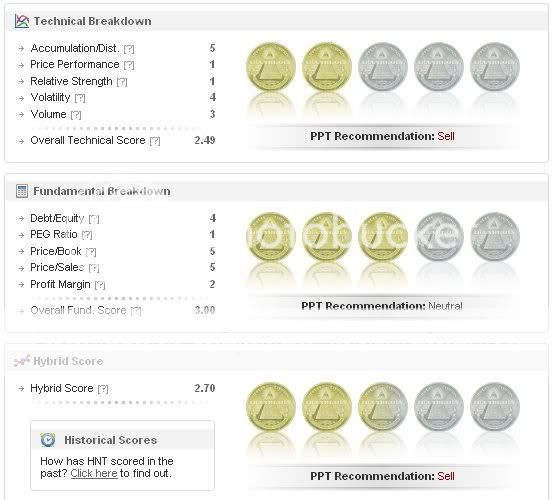
1Option – DNA, HNT
No. Date Rank – Daily Close Technicals Fundamentals Hybrid Score Hybrid Change
1 2009-01-08 1411 84.40 2.07 3.30 2.59 (Sell) -14.24%
2 2009-01-07 290 84.53 2.81 3.30 3.02 (Buy) 0.67%
3 2009-01-06 1144 84.00 2.78 3.30 3.00 (Neutral) 2.04%
4 2009-01-05 1277 83.00 2.68 3.30 2.94 (Sell) 19.51%
5 2009-01-02 2677 82.60 1.85 3.30 2.46 (Sell) -15.46%
6 2008-12-31 1492 82.91 2.62 3.30 2.91 (Sell) 23.31%
7 2008-12-30 82.28 1.68 3.30 2.36 (Sell) 3.96%
8 2008-12-29 81.97 1.51 3.30 2.27 (Sell) 15.23%
9 2008-12-26 2190 82.21 1.00 3.30 1.97 (Strong Sell) -12.83%
10 2008-12-24 1417 82.80 2.00 3.30 2.55 (Sell) -5.56%
11 2008-12-23 1147 83.00 2.25 3.30 2.70 (Sell) -15.89%
12 2008-12-19 83.75 3.14 3.30 0.00 (Strong Sell) 0.00%
13 2008-12-18 80.30 2.95 3.30 0.00 (Strong Sell) 0.00%
14 2008-12-17 78.75 2.48 3.30 0.00 (Strong Sell) 0.00%
15 2008-12-16 77.59 1.51 1.90 0.00 (Strong Sell) 0.00%
No. Date Rank – Daily Close Technicals Fundamentals Hybrid Score Hybrid Change
1 2009-01-08 525 13.71 2.87 3.00 2.92 (Sell) 8.55%
2 2009-01-07 944 13.38 2.46 3.00 2.69 (Sell) -3.58%
3 2009-01-06 1638 12.70 2.63 3.00 2.79 (Sell) 6.90%
4 2009-01-05 2112 12.05 2.33 3.00 2.61 (Sell) 1.56%
5 2009-01-02 2524 11.43 2.25 3.00 2.57 (Sell) 1.18%
6 2008-12-31 2366 10.89 2.27 2.90 2.54 (Sell) 5.83%
7 2008-12-30 11.00 2.03 2.90 2.40 (Sell) 29.03%
8 2008-12-29 10.49 1.11 2.90 1.86 (Strong Sell) 0.00%
9 2008-12-26 2502 10.75 1.10 2.90 1.86 (Strong Sell) -7.00%
10 2008-12-24 2703 10.71 1.35 2.90 2.00 (Sell) -1.48%
11 2008-12-23 2773 10.54 1.40 2.90 2.03 (Sell) -5.14%
12 2008-12-19 2747 10.73 1.59 2.90 2.14 (Sell) -1.83%
13 2008-12-18 2630 10.87 1.65 2.90 2.18 (Sell) 0.46%
14 2008-12-17 2726 10.77 1.63 2.90 2.17 (Sell) -12.15%
15 2008-12-16 2009 11.04 2.16 2.90 2.47 (Sell) 15.96%
16 2008-12-15 2378 10.41 1.57 2.90 2.13 (Sell) -7.39%
17 2008-12-12 2199 10.49 1.86 2.90 2.30 (Sell) 0.44%
18 2008-12-11 2078 10.31 1.84 2.90 2.29 (Sell) 4.57%
19 2008-12-10 2803 10.19 1.67 2.90 2.19 (Sell) -11.34%
20 2008-12-09 2498 10.01 2.16 2.90 2.47 (Sell) -13.94%
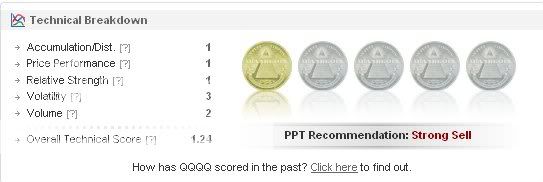
Private Parts – SPY, QQQQ (no funamental scores), FAZ (not enough data for price scoring)
No. Date Close Technicals
1 2009-01-08 91.04 1.47 Strong Sell
2 2009-01-07 90.67 1.46 Strong Sell
3 2009-01-06 93.47 2.43 Sell
4 2009-01-05 92.85 2.53 Sell
5 2009-01-02 92.96 2.45 Sell
6 2008-12-31 90.24 2.47 Sell
7 2008-12-30 88.97 2.28 Sell
8 2008-12-29 86.91 1.36 Strong Sell
9 2008-12-26 87.16 1.1 Strong Sell
10 2008-12-24 86.66 1.35 Strong Sell
11 2008-12-23 86.16 1.4 Strong Sell
12 2008-12-19 88.19 1.54 Strong Sell
13 2008-12-18 88.57 1.85 Strong Sell
14 2008-12-17 90.26 2.38 Sell
15 2008-12-16 91.14 2.36 Sell
16 2008-12-15 87.04 1.47 Strong Sell
17 2008-12-12 88.27 1.51 Strong Sell
18 2008-12-11 87.23 1.49 Strong Sell
19 2008-12-10 89.38 2.07 Sell
20 2008-12-09 88.78 2.06 Sell
No. Date Close Technicals
1 2009-01-08 30.76 1.47 Strong Sell
2 2009-01-07 30.44 1.46 Strong Sell
3 2009-01-06 31.33 2.43 Sell
4 2009-01-05 31.02 2.53 Sell
5 2009-01-02 31.03 2.45 Sell
6 2008-12-31 29.74 2.22 Sell
7 2008-12-30 29.49 2.03 Sell
8 2008-12-29 28.89 1.11 Strong Sell
9 2008-12-26 29.13 1.1 Strong Sell
10 2008-12-24 29.14 1.35 Strong Sell
11 2008-12-23 29.06 1.4 Strong Sell
12 2008-12-19 29.86 1.34 Strong Sell
13 2008-12-18 29.62 1.8 Strong Sell
14 2008-12-17 30.15 2.13 Sell
15 2008-12-16 30.52 2.11 Sell
16 2008-12-15 29.12 1.47 Strong Sell
17 2008-12-12 29.64 1.51 Strong Sell
18 2008-12-11 29.05 1.49 Strong Sell
19 2008-12-10 29.87 2.07 Sell
20 2008-12-09 29.97 2.81 Sell
Larry Flint – PAAS (not in db yet), GE
No. Date Rank – Daily Close Technicals Fundamentals Hybrid Score Hybrid Change
1 2009-01-08 2506 16.14 1.30 3.30 2.14 (Sell) 5.94%
2 2009-01-07 2669 16.11 1.08 3.30 2.02 (Sell) -8.18%
3 2009-01-06 2917 16.86 1.40 3.30 2.20 (Sell) -2.22%
4 2009-01-05 2817 16.63 1.48 3.30 2.25 (Sell) -13.79%
5 2009-01-02 2429 17.07 2.10 3.30 2.61 (Sell) 1.95%
6 2008-12-31 2309 16.20 2.20 3.05 2.56 (Sell) 30.61%
7 2008-12-30 15.82 1.30 2.87 1.96 (Strong Sell) 5.95%
8 2008-12-29 15.66 1.11 2.87 1.85 (Strong Sell) 0.00%
9 2008-12-26 2522 15.97 1.10 2.87 1.85 (Strong Sell) 0.00%
10 2008-12-24 2701 16.11 1.36 2.87 2.00 (Sell) 0.00%
11 2008-12-23 2831 16.12 1.36 2.87 2.00 (Sell) -9.91%
12 2008-12-19 2612 16.19 1.74 2.87 2.22 (Sell) 8.29%
13 2008-12-18 2858 15.66 1.44 2.87 2.05 (Sell) -5.53%
14 2008-12-17 2725 17.06 1.66 2.87 2.17 (Sell) -13.20%
15 2008-12-16 1932 17.58 2.23 2.87 2.50 (Sell) 27.55%
16 2008-12-15 2734 16.63 1.29 2.87 1.96 (Strong Sell) -1.51%
17 2008-12-12 2816 16.79 1.35 2.87 1.99 (Strong Sell) 0.00%
18 2008-12-11 2736 16.73 1.34 2.87 1.99 (Strong Sell) -5.24%
19 2008-12-10 2909 17.66 1.54 2.87 2.10 (Sell) -10.64%
20 2008-12-09 2700 17.44 1.96 2.87 2.35 (Sell) -20.34%
Anj – SAY (fyi – nothing protects against fraud)
No. Date Rank – Daily Close Technicals Fundamentals Hybrid Score Hybrid Change
1 2009-01-08 153 9.35 2.02 4.99 3.27 (Buy) 0.00%
2 2009-01-07 111 9.35 2.01 4.99 3.27 (Buy) -2.68%
3 2009-01-06 400 9.35 2.18 4.99 3.36 (Buy) 18.31%
4 2009-01-05 1525 8.99 1.28 4.99 2.84 (Sell) -8.09%
5 2009-01-02 1256 8.98 1.70 5.00 3.09 (Buy) -8.85%
6 2008-12-31 375 9.04 2.22 5.00 3.39 (Buy) 1.19%
7 2008-12-30 8.75 2.23 4.90 3.35 (Buy) 2.13%
8 2008-12-29 8.41 2.11 4.90 3.28 (Buy) -3.24%
9 2008-12-26 15 7.92 2.30 4.90 3.39 (Buy) 14.53%
10 2008-12-24 95 7.63 2.20 4.90 3.34 (Buy) 11.71%
11 2008-12-23 378 7.35 1.60 4.90 2.99 (Sell) -10.21%
12 2008-12-19 251 7.83 2.19 4.90 3.33 (Buy) 1.52%
13 2008-12-18 309 8.22 2.10 4.90 3.28 (Buy) 3.14%
14 2008-12-17 620 8.55 1.93 4.90 3.18 (Buy) 17.78%
15 2008-12-16 1448 5.70 1.11 4.90 2.70 (Sell) 1.50%
16 2008-12-15 1098 12.55 1.47 4.30 2.66 (Sell) -24.00%
17 2008-12-12 68 12.66 2.71 4.60 3.50 (Buy) 22.38%
18 2008-12-11 709 12.22 1.49 4.75 2.86 (Sell) -6.54%
19 2008-12-10 975 12.21 1.82 4.75 3.06 (Buy) -7.55%
20 2008-12-09 617 12.15 2.26 4.75 3.31 (Buy) 2.16%
Braveflaps – DRYS
No. Date Rank – Daily Close Technicals Fundamentals Hybrid Score Hybrid Change
1 2009-01-08 54 15.13 2.52 4.90 3.52 (Buy) 19.73%
2 2009-01-07 387 12.96 1.51 4.90 2.94 (Sell) -21.18%
3 2009-01-06 54 15.23 2.88 4.90 3.73 (Buy) 1.63%
4 2009-01-05 98 13.85 2.78 4.90 3.67 (Buy) 4.56%
5 2009-01-02 315 12.49 2.50 4.90 3.51 (Buy) 6.36%
6 2008-12-31 566 10.66 2.32 4.65 3.30 (Buy) 23.60%
7 2008-12-30 9.62 1.38 4.46 2.67 (Sell) 3.89%
8 2008-12-29 8.99 1.21 4.46 2.57 (Sell) 0.00%
9 2008-12-26 582 9.69 1.20 4.46 2.57 (Sell) 0.00%
10 2008-12-24 869 9.49 1.45 4.46 2.71 (Sell) -8.75%
11 2008-12-23 424 9.59 1.90 4.46 2.97 (Sell) 1.02%
12 2008-12-19 840 11.23 1.84 4.46 2.94 (Sell) -19.23%
13 2008-12-18 67 12.28 3.05 4.46 3.64 (Buy) 7.06%
14 2008-12-17 233 12.43 2.63 4.46 3.40 (Buy) -6.08%
15 2008-12-16 44 11.13 3.01 4.46 3.62 (Buy) 10.70%
16 2008-12-15 119 10.19 2.42 4.46 3.27 (Buy) 7.57%
17 2008-12-12 408 9.37 2.01 4.46 3.04 (Buy) -7.60%
18 2008-12-11 180 8.86 2.44 4.46 3.29 (Buy) -12.73%
19 2008-12-10 62 10.71 3.27 4.46 3.77 (Buy) -3.58%
20 2008-12-09 35 9.45 3.51 4.46 3.91 (Buy) 3.44%
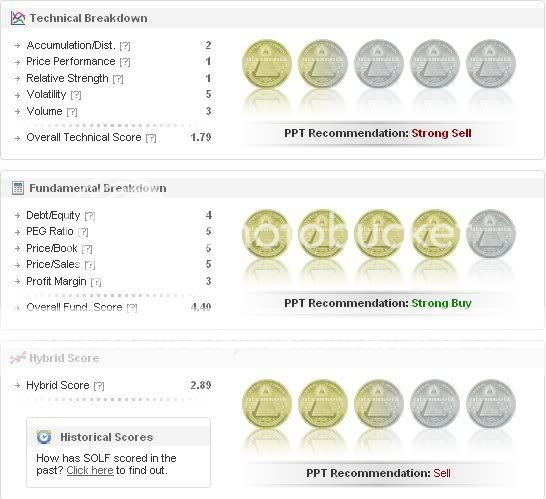
JJ – LDK, ESRX, AVAV, SOLF
No. Date Rank – Daily Close Technicals Fundamentals Hybrid Score Hybrid Change
1 2009-01-08 901 14.50 1.57 4.40 2.76 (Sell) -8.61%
2 2009-01-07 287 13.78 1.91 4.55 3.02 (Buy) -11.18%
3 2009-01-06 330 14.99 2.68 4.40 3.40 (Buy) 1.49%
4 2009-01-05 505 14.84 2.58 4.40 3.35 (Buy) 3.40%
5 2009-01-02 884 13.97 2.30 4.55 3.24 (Buy) 14.89%
6 2008-12-31 1690 13.12 1.57 4.55 2.82 (Sell) -10.48%
7 2008-12-30 13.50 2.13 4.55 3.15 (Buy) 20.69%
8 2008-12-29 12.67 1.21 4.55 2.61 (Sell) 0.00%
9 2008-12-26 474 12.52 1.20 4.55 2.61 (Sell) 0.00%
10 2008-12-24 752 12.39 1.45 4.55 2.75 (Sell) -1.08%
11 2008-12-23 931 12.80 1.50 4.55 2.78 (Sell) -5.76%
12 2008-12-19 826 13.90 1.89 4.40 2.95 (Sell) -1.01%
13 2008-12-18 806 12.95 1.85 4.55 2.98 (Sell) -8.59%
14 2008-12-17 448 14.79 2.43 4.40 3.26 (Buy) 2.19%
15 2008-12-16 435 13.25 2.21 4.55 3.19 (Buy) 18.15%
16 2008-12-15 988 12.03 1.37 4.55 2.70 (Sell) -5.92%
17 2008-12-12 767 12.64 1.66 4.55 2.87 (Sell) 1.41%
18 2008-12-11 766 12.13 1.59 4.55 2.83 (Sell) -5.35%
19 2008-12-10 1127 11.79 1.87 4.55 2.99 (Sell) -4.47%
20 2008-12-09 1007 11.69 2.11 4.55 3.13 (Buy) 7.93%
No. Date Rank – Daily Close Technicals Fundamentals Hybrid Score Hybrid Change
1 2009-01-08 1396 55.50 1.67 3.85 2.59 (Sell) 4.86%
2 2009-01-07 1556 55.68 1.46 3.85 2.47 (Sell) -21.59%
3 2009-01-06 811 57.33 2.63 3.85 3.15 (Buy) 13.72%
4 2009-01-05 1703 57.12 1.98 3.85 2.77 (Sell) 2.97%
5 2009-01-02 2240 56.69 1.85 3.85 2.69 (Sell) 3.86%
6 2008-12-31 2253 54.98 1.67 3.85 2.59 (Sell) 9.75%
7 2008-12-30 57.36 1.28 3.85 2.36 (Sell) -2.07%
8 2008-12-29 58.43 1.36 3.85 2.41 (Sell) 6.64%
9 2008-12-26 1491 59.21 1.10 3.85 2.26 (Sell) -5.83%
10 2008-12-24 1395 58.21 1.60 3.85 2.55 (Sell) -1.16%
11 2008-12-23 1512 59.07 1.65 3.85 2.58 (Sell) -20.37%
12 2008-12-19 320 61.35 2.79 3.85 3.24 (Buy) 15.30%
13 2008-12-18 1195 59.35 2.05 3.85 2.81 (Sell) 0.36%
14 2008-12-17 1471 59.41 2.03 3.85 2.80 (Sell) -13.04%
15 2008-12-16 375 61.36 2.76 3.85 3.22 (Buy) 21.51%
16 2008-12-15 1145 58.80 1.77 3.85 2.65 (Sell) 5.16%
17 2008-12-12 1699 57.48 1.56 3.85 2.52 (Sell) 0.40%
18 2008-12-11 1603 57.72 1.54 3.85 2.51 (Sell) -7.04%
19 2008-12-10 1805 59.08 1.87 3.85 2.70 (Sell) -8.78%
20 2008-12-09 1420 58.01 2.31 3.85 2.96 (Sell) -9.48%
No. Date Rank – Daily Close Technicals Fundamentals Hybrid Score Hybrid Change
1 2009-01-08 48 36.89 3.22 4.05 3.57 (Buy) 3.48%
2 2009-01-07 49 36.75 3.01 4.05 3.45 (Buy) -9.92%
3 2009-01-06 28 37.78 3.68 4.05 3.83 (Buy) -11.55%
4 2009-01-05 4 39.38 4.53 4.05 4.33 (Strong Buy) 3.84%
5 2009-01-02 14 38.26 4.25 4.05 4.17 (Strong Buy) 2.71%
6 2008-12-31 27 36.81 4.07 4.05 4.06 (Strong Buy) 4.91%
7 2008-12-30 35.41 3.63 4.20 3.87 (Buy) 20.19%
8 2008-12-29 34.40 2.51 4.20 3.22 (Buy) 4.89%
9 2008-12-26 59 32.89 2.25 4.20 3.07 (Buy) 0.00%
10 2008-12-24 79 32.82 2.75 4.20 3.36 (Buy) 3.70%
11 2008-12-23 155 33.78 2.55 4.20 3.24 (Buy) -11.72%
12 2008-12-19 50 34.00 3.29 4.20 3.67 (Buy) -11.99%
13 2008-12-18 6 36.00 4.15 4.20 4.17 (Strong Buy) 3.22%
14 2008-12-17 14 34.81 3.93 4.20 4.04 (Strong Buy) 21.32%
15 2008-12-16 222 34.05 2.71 4.20 3.33 (Buy) -8.26%
16 2008-12-15 23 33.58 3.22 4.20 3.63 (Buy) 6.14%
17 2008-12-12 103 34.28 2.86 4.20 3.42 (Buy) -6.04%
18 2008-12-11 28 33.00 3.24 4.20 3.64 (Buy) -4.21%
19 2008-12-10 46 34.78 3.52 4.20 3.80 (Buy) 0.80%
20 2008-12-09 83 33.50 3.46 4.20 3.77 (Buy) 13.55%
No. Date Rank – Daily Close Technicals Fundamentals Hybrid Score Hybrid Change
1 2009-01-08 1680 5.77 1.12 4.40 2.50 (Sell) -15.54%
2 2009-01-07 360 5.32 1.91 4.40 2.96 (Sell) -4.21%
3 2009-01-06 957 5.85 2.13 4.40 3.09 (Buy) -5.21%
4 2009-01-05 673 6.12 2.58 4.20 3.26 (Buy) 12.80%
5 2009-01-02 1697 5.40 1.95 4.20 2.89 (Sell) 6.64%
6 2008-12-31 1999 5.01 1.77 4.00 2.71 (Sell) -7.19%
7 2008-12-30 5.25 2.13 4.00 2.92 (Sell) 15.42%
8 2008-12-29 4.80 1.46 4.00 2.53 (Sell) 6.30%
9 2008-12-26 1202 4.79 1.20 4.00 2.38 (Sell) 0.00%
10 2008-12-24 1485 4.66 1.45 4.00 2.52 (Sell) -1.18%
11 2008-12-23 1570 4.79 1.50 4.00 2.55 (Sell) 1.19%
12 2008-12-19 2027 4.99 1.44 4.00 2.52 (Sell) -8.36%
13 2008-12-18 1346 4.78 1.85 4.00 2.75 (Sell) -7.41%
14 2008-12-17 1056 5.14 2.23 4.00 2.97 (Sell) 24.79%
15 2008-12-16 2183 4.79 1.21 4.00 2.38 (Sell) -3.64%
16 2008-12-15 1596 4.74 1.37 4.00 2.47 (Sell) -5.36%
17 2008-12-12 1512 4.71 1.61 4.00 2.61 (Sell) 4.82%
18 2008-12-11 1658 4.70 1.39 4.00 2.49 (Sell) -7.09%
19 2008-12-10 1861 4.90 1.72 4.00 2.68 (Sell) 0.37%
20 2008-12-09 2107 4.69 1.71 4.00 2.67 (Sell) -4.98%
Leonard – AZO
No. Date Rank – Daily Close Technicals Fundamentals Hybrid Score Hybrid Change
1 2009-01-08 1099 135.86 2.07 3.55 2.69 (Sell) -10.33%
2 2009-01-07 308 135.44 2.61 3.55 3.00 (Neutral) -7.69%
3 2009-01-06 622 139.20 3.03 3.55 3.25 (Buy) -2.40%
4 2009-01-05 532 137.73 3.18 3.55 3.33 (Buy) -10.48%
5 2009-01-02 117 140.57 3.85 3.55 3.72 (Buy) -3.38%
6 2008-12-31 54 139.47 4.07 3.55 3.85 (Buy) 20.69%
7 2008-12-30 137.25 2.93 3.55 3.19 (Buy) 13.93%
8 2008-12-29 132.69 2.26 3.55 2.80 (Sell) -13.04%
9 2008-12-26 30 132.23 2.75 3.85 3.22 (Buy) 9.90%
10 2008-12-24 648 129.97 2.00 3.85 2.78 (Sell) -8.55%
11 2008-12-23 307 129.71 2.45 3.85 3.04 (Buy) -5.30%
12 2008-12-19 356 131.62 2.74 3.85 3.21 (Buy) -4.46%
13 2008-12-18 212 135.77 3.00 3.85 3.36 (Buy) 0.30%
14 2008-12-17 291 134.27 2.98 3.85 3.35 (Buy) 0.30%
15 2008-12-16 214 133.50 2.96 3.85 3.34 (Buy) 7.40%
16 2008-12-15 216 129.02 2.57 3.85 3.11 (Buy) -9.06%
17 2008-12-12 105 129.60 3.11 3.85 3.42 (Buy) 9.62%
18 2008-12-11 314 126.06 2.59 3.85 3.12 (Buy) -12.61%
19 2008-12-10 216 128.62 3.37 3.85 3.57 (Buy) -0.83%
20 2008-12-09 218 124.51 3.41 3.85 3.60 (Buy) 13.92%
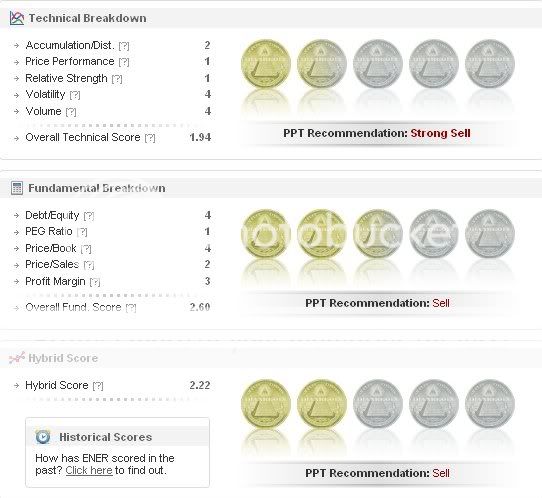
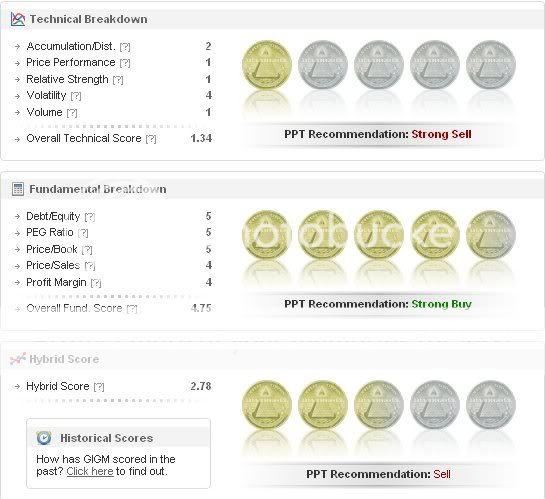
Dizzles – ENER, GIGM
No. Date Rank – Daily Close Technicals Fundamentals Hybrid Score Hybrid Change
1 2009-01-08 2978 28.97 1.32 2.60 1.86 (Strong Sell) -1.59%
2 2009-01-07 2884 26.74 1.26 2.75 1.89 (Strong Sell) -14.48%
3 2009-01-06 2903 29.21 1.93 2.60 2.21 (Sell) -13.67%
4 2009-01-05 2262 29.38 2.53 2.60 2.56 (Sell) 4.92%
5 2009-01-02 2717 27.80 2.20 2.75 2.44 (Sell) -1.61%
6 2008-12-31 2481 25.21 2.27 2.75 2.48 (Sell) 4.64%
7 2008-12-30 24.84 2.08 2.75 2.37 (Sell) 19.70%
8 2008-12-29 23.45 1.41 2.75 1.98 (Strong Sell) 8.20%
9 2008-12-26 2581 23.41 1.15 2.75 1.83 (Strong Sell) 0.00%
10 2008-12-24 2756 22.80 1.40 2.75 1.97 (Strong Sell) -1.50%
11 2008-12-23 2833 23.22 1.45 2.75 2.00 (Sell) -9.09%
12 2008-12-19 2646 24.72 1.79 2.75 2.20 (Sell) -5.17%
13 2008-12-18 2353 25.08 2.00 2.75 2.32 (Sell) -3.33%
14 2008-12-17 2366 25.89 2.13 2.75 2.40 (Sell) 23.08%
15 2008-12-16 2865 22.93 1.36 2.75 1.95 (Strong Sell) -0.51%
16 2008-12-15 2740 20.86 1.27 2.90 1.96 (Strong Sell) -11.31%
17 2008-12-12 2381 22.59 1.71 2.90 2.21 (Sell) 9.41%
18 2008-12-11 2673 22.20 1.49 2.75 2.02 (Sell) -5.16%
19 2008-12-10 2863 21.83 1.57 2.90 2.13 (Sell) -10.88%
20 2008-12-09 2637 22.05 2.01 2.90 2.39 (Sell) 1.70%
No. Date Rank – Daily Close Technicals Fundamentals Hybrid Score Hybrid Change
1 2009-01-08 255 6.61 1.92 4.75 3.11 (Buy) 2.98%
2 2009-01-07 323 6.46 1.76 4.75 3.02 (Buy) -14.45%
3 2009-01-06 160 6.93 2.63 4.75 3.53 (Buy) 5.37%
4 2009-01-05 504 6.63 2.33 4.75 3.35 (Buy) -6.94%
5 2009-01-02 209 6.01 2.65 4.90 3.60 (Buy) 16.50%
6 2008-12-31 1104 5.63 1.77 4.90 3.09 (Buy) 14.87%
7 2008-12-30 5.31 1.08 4.90 2.69 (Sell) -1.47%
8 2008-12-29 5.48 1.16 4.90 2.73 (Sell) 0.00%
9 2008-12-26 233 5.60 1.15 4.90 2.73 (Sell) -4.88%
10 2008-12-24 443 5.74 1.40 4.90 2.87 (Sell) -4.97%
11 2008-12-23 325 5.87 1.65 4.90 3.02 (Buy) -2.58%
12 2008-12-19 510 5.95 1.79 4.90 3.10 (Buy) 3.68%
13 2008-12-18 778 5.78 1.60 4.90 2.99 (Sell) -8.28%
14 2008-12-17 444 6.48 2.18 4.75 3.26 (Buy) -7.91%
15 2008-12-16 69 5.93 2.56 4.90 3.54 (Buy) -8.53%
16 2008-12-15 4 5.90 3.12 4.90 3.87 (Buy) 2.38%
17 2008-12-12 13 5.77 2.96 4.90 3.78 (Buy) 0.27%
18 2008-12-11 9 5.37 2.94 4.90 3.77 (Buy) 8.96%
19 2008-12-10 350 4.80 2.42 4.90 3.46 (Buy) 9.15%
20 2008-12-09 905 4.59 1.91 4.90 3.17 (Buy) -11.94%













Interesting review. PPT looks like a fit.
How about stats on XLF?
bg
Have you tested or backtested PPT to identify & trade (spiker) shorts in a similar fashion as your spiker longs?
DNA and HNT
Thanks.
SPY
QQQQ
FAZ
many thanks
How about PAAS and GE? Also, how do we sign up for this service?
SAY
I guess if you beleive in the fianacial statements then a quant system makes sense….. Enron WorldCon Satyam…. you get the drift.
Using ETF’s company specific risk is reduced.
got the weak Friday close ( that I was looking for at the start of the week) looking for intraday reversal on Monday. Notice the full Moon was this weekend ……last full moon was Dec 12 th where the low was 84… had a 100 point rally on the SPY……
Want to see fast price destruction on light volume to set up the buy.
OK now I get this PPT thing…
SOLD!!
But what are you using to identify your spikers in the first place?
And would you mind crunching DRYS with the PPT?
Braveflaps,
Fly and I were talking about PPT last night. DRYS and TBSI signals and numbers are in Danny’s tab with the conversation. And ,as stated last night, fucking accurate. Plain and simple. PPT nailed my whole trade in DRYS day by day and even my exit on the same day…theres is no question about it the best to COMPLEMENT and to CONFIRM your trades…not to pick stocks and trade BLINDLY…
For me personally, i told Fly im his first customer, because i already know it cuts my time down doing research and wil be used as a confirmation tool. I trade technicals, but a little overview of the fundamentals helps.
LDK, ESRX, AVAV and SOLF
thanks in advance
Freddy,
Muchos!!
I will have to check out G&M’s restaurant in Linthicum – my fav place back in the old days was a little shack called Anne Arundel Seafood in Pasadena. Miss that place.
How about a scan on AZO?
ENER GIGM
Cheers
Getting started on requests now. Saw DJ Sam Ronson, Lindsay Lohan’s lover, last night. She’s good.
Juice – Spiker shorts do not work well when a bottom is forming. The spikers usually consolidate and not drop off. When the market goes into the shitcan, I’ll give plenty of examples.
Braveflaps – That’s my own strategy. I realized the PPT would have confirmed all of my decisions. Sort of like another brain.
Leonard – Go. You’ll thank me later.
BG – XLF
1Option – DNA, HNT
Private Parts – SPY, QQQQ, FAZ
Larry “ain’t gonna get the bailout money” Flint – PAAS, GE
Anj -SAY
Braveflaps – DRYS
JJ – LDK, ESRX, AVAV, SOLF
Leonard – AZO
Dizzles – ENER, GIGM
So what happens when everybody and his brother starts using this system? Can success kill you? Or am I overestimating the reach of IBC?
Everyone seeks the Holy Grail of Trading.
OpihiMan,
Its just a TOOL…
How many people are using IBD?…
How many people are using VectorVest?
Are they making money?
No such thing as Holy Grail. It is a Godly Grail.
HI
Could you run SLW and AEM?
thanks
John
SRS, JASO… thanks!
Does PPT work with Indexes? If so I would like to see what it has to say about the SPX/SPY!
GS & MA!
How bout AIZ, KWK, DRC & MAN ….
TIA
True, Freddy, but IBD, VV et al. don’t appear to be in the same class as PPT when it comes to buy/sell triggers.
Anyway, I’m relieved by Fly’s assurance that PPT is a “godly” system. For a while, I was worried that the subscription cost for this service would be “ungodly.”
OpihiMan Says
“So what happens when everybody and his brother starts using this system? Can success kill you? Or am I overestimating the reach of IBC?”
What i meant is how many people use the IBD CANSLIM formula? Most likely millions, IBD has a readership of 850,000 and many of them apply the principles at the same time, some trade daily, others weekly. Same is DailyGraphs and VectorVest. You should have no fear of every one using the PPT. Just adapt it to your unique trading style.
NLY, FMY, AIB & AWK
Thanks!
Thanks for the info John
FK – agree, valid arguments. I’ve always thought that you lose an edge when too many people are in on the same system. . . and beyond that, people will also start gaming the system (i.e., “trade the trader”). But even if such a tipping point exists, you’re right — it would take huge volume to have an appreciable effect. . . and even then, I suppose it could conceivably work in your favor as much as it could against you (just as common TA patterns may have come to work simply because so many people believe they do).
My greed is showing. Still, I find myself not wanting to let others know about this awesome site, much less PPT. Tsk, tsk.
And how does a bleary eyed trader obtain said holy grail to confirm his TA?
GOAT
TCA-
How about OSK. I follow it closely and curious how the PPT screens it. Thanks for the extra insight you have provided to iBC and I’m looking forward to the PPT!
John – SLW, AEM
EN1GMA – SRS, JASO
Lerner – GS, MA
E8 – AIZ, KWK, DRC, MAN
Sleepy – NLY, FMY, AIB, AWK
Fast Eddie – OSK
Goat – Fly will post details in the near future.
Btw, what will the PPT monthly subscription price be once it’s active?
between 29.99-49.99 per month, depending on length of subscription.
cool… sounds like a reasonable price
That was my goal.