iBankCoin
Joined Nov 11, 2007
1,458 Blog Posts

Beware the Abnormal Market

Over the last 9 days, SPY has bounced from beneath the lower Bollinger Band to rest just beneath the upper Bollinger Band. A close above the upper Bollinger Band will signal an abnormal market.

I will be watching for a close above the upper Bollinger over the next couple of days. Should it happen, it will effectively turn off any short signals I may be considering.

Here is a previous post I wrote on the topic of closes above the upper Bollinger Band, and why they can signal an abnormal market.

Abnormally Overbought Is Not Bearish

Note the leap from beneath the lower to just beneath the upper Bollinger Bands. As a bonus, the ROC indicator is in the bottom pane. It is still signaling short. However, it appears that a healthy pullback may flip it back to long again.

Comments »

Why We May Be Looking at the Bottom

The 7 day rate-of-change (ROC7) for SPY is 9.84%. Looking back over 40 years, a ROC7 of greater than 9% has occurred only 44 times. Standard thinking would have us looking for a pullback here. Testing this setup shows that the move higher is likely to continue.

I’ve got a short position open that I rode down to the recent new low, and have ridden back up to our current close. I’m looking for a pullback here because I want to close the short for break-even and put some cash to work. Plus, it just makes sense that after the market goes up almost 10% with no pullbacks, that it will pullback. Unfortunately, such a strong and forceful move like we’ve seen over the past 7 days seems to indicate a change in the market, and the change looks like it might be an uptrend. If we do see an uptrend develop, look for volatility to quickly dissipate.

The Rules:

Buy SPY at the close if:

  • The 7 day rate of change is greater than 8% (I lowered the threshold to 8% to obtain a larger sample)
  • Sell X days later
  • Also look at when SPY is beneath its 200 day moving average
  • Include 60 years of $SPX data

No commissions or slippage included. All SPY history used.

The Results:

Analysis of Results:

SPY ROC7>8 had a sample size of 28 setups with 13 trades held for the full 50 days.

SPY <MA200 had a sample size of 21 setups with 9 trades held for the full 50 days.

$SPX < MA200 had a sample size of 31 setups with 16 trades held for the full 50 days. The first trade was in 1962.

These results do not need an in-depth explanation. They are bullish. In the past there has been a small pullback, and then it has been off to the races.

Frankly, these results do not square very well with this study about SPY re-taking the 50 day moving average. I’m inclined to believe that such a powerful move up negates the influence of the 50 day moving average.

Comments »

ROC Indicator is Short Again

As of Monday’s close, the ROC Indicator is short again.

Note that the short-term line (red) is higher than the long-term line (blue).

Some readers have asked about the indicator switching back and forth. I have some ideas on this, which I’ll explore in a future post.

Comments »

S&P 500 Beneath the 50 Day Avg. for More than 50 Days, Now Above. What Now?

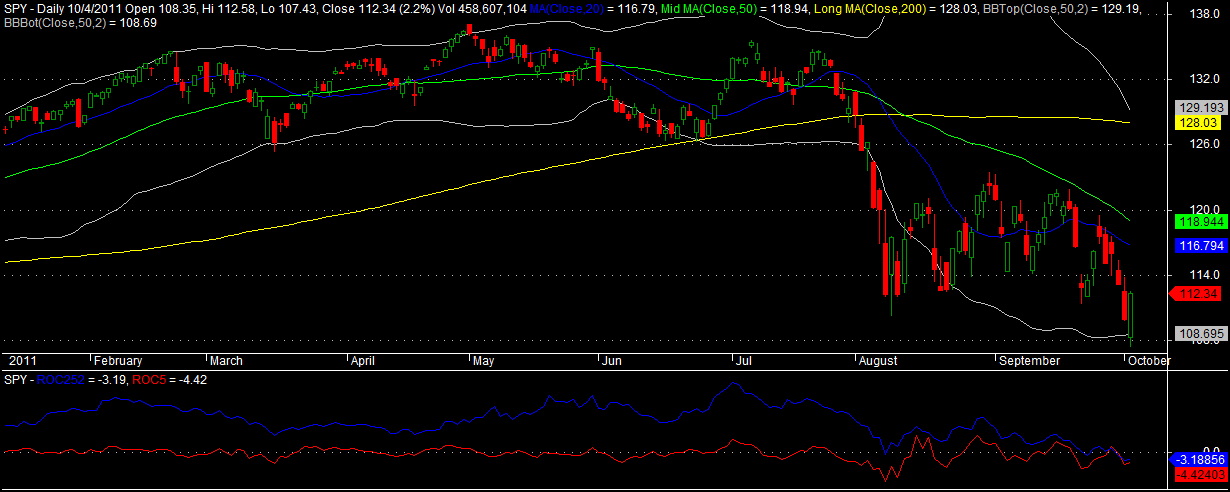
Today, after trading beneath the 50 day moving average for more than 50 days (52 days, to be exact), the S&P 500 surged to close above the average. What can we expect going forward in the short and intermediate time frames?

You have likely already heard the hubbub across the financial landscape about the S&P and Dow Jones averages closing above their 50 day moving averages (MA50). Frankly, these averages are helpful only if they are not used to make binary trading decisions. Just because the index closes above it, or below it, doesn’t mean one should immediately go out and buy or sell. However, a close above the MA50 does serve as a warning that a change of trend may be underway. In fact, if we do use it as a binary signal, the decision may be to buy the first pullback after a close above the MA50 (the results below will illustrate why this may be a profitable decision).

But I digress.

What we want to look at is how we should incorporate the amount of time spent beneath the average into our trading decisions. Surely, being back above the MA50 is a positive development, but just how excited should we be? Should we be chomping at the bit to initiate new positions, or should we be more patient? If we consider how long the index has traded beneath its MA50 before again closing above it, we can answer that question.

The Rules:

Buy SPY at the close if

  • It has traded for more than  X days beneath the MA50 and then closes above the average
  • Sell Y days later

No commissions or slippage included. All SPY history used.

The Results:

Analysis of Results:

Let’s start with the green line.  There were 123 setups and 34 trades held the full 100 days. A market that has traded for just a few days beneath the MA50 and then closes above it may have completed a healthy pullback. Or, the green line may represent a market that has vacillated around the MA50. Regardless, this setup is the least volatile going forward but also achieves the smallest returns after 100 days. Why the low volatility and low returns? My guess is that a market that is vacillating around the MA50 is may tend to have some momentum remaining from the previous uptrend (hence, the low volatility) but may also be subject to increasing downward pressure (hence the lower returns).

The blue line, with 19 setups and 16 trades held the full 100 days, is more rare. We can see that a market that has traded for a month or so beneath the MA50 will be more volatile going forward, after it regains the MA50.

The red line is the closest model to our current market. This condition is rare. With over 17 years of SPY data available, there were only 6 setups, and all 6 were held for the full 100 days. This setup is the most volatile going forward but also achieves the highest returns after 100 days. Note the multiple pullbacks averaging near -2%.

What Does It All Mean?

The bottom line is this: In all of the models, SPY does not achieve an average return greater than 1% until 55 trading days after the setup. The >25 and >50 models do not achieve an average return greater than 1% until 4 months (90 trading days) have passed. The risk of another downside move appears to be greater than that of an upside move.

Patience will be a profitable virtue.

While there is growing evidence that the bear market may be waning, volatility will remain very high. Going forward, this is still a trader’s market. There will be plenty of pullbacks to buy and rips to sell. Putting some cash to work on the dips may be appropriate for longer-term investors, but be prepared for a volatility whipsaw.

Comments »

5 Day Moving Average Indicator Suggesting Weakness Ahead

The futures are in full melt-up mode, but this reliable indicator suggests there is weakness ahead.

The indicator is very simple. If SPY is trading beneath its 200 day moving average, short it at the close when there are more than 3000 stocks trading above their 5 day moving averages. The short is closed when the number of stocks trading above their 5 day moving averages falls beneath 700.

The win rate for this indicator is 81.25% and the average trade is 1.78%.

The arrows show the shorts (red arrows) and the covers (green arrows). The  red line in the lower pane shows the indicator.

Comments »

Top Short Setups

I may be a day or so early with these. Trading just before the employment report is released (Friday) is always a gamble. If I had to guess, I would guess that a large gap up today will be sold.

No time for anything but symbols today…

LAD

DDD

SPPI

AEA

COG

MITK

Have a great day!

Comments »

ROC Indicator Crossed Again, Signaling Long

That was quick, wasn’t it?

As of Tuesday’s close, the ROC5 was at -4.42 and the ROC252 was at -3.19. On Monday’s close, the ROC5 was also below the ROC252. This means that the short signal has been satisfied and now the indicator is saying to go long.

I believe some whipsaw is normal when the indicator starts crossing. If the market rallies further here, it may cross again, indicating another short.

Keep in mind this is a long-term indicator. While this last short was profitable, it is not designed to catch short-term swings. Instead, it wants to catch long trends. Soon enough, it will settle onto one side or another.

Here is the original post on this indicator: Simple, Long-Term Indicator Near to Giving Short Signal.

Comments »